CASE STUDY:
NETWORK ANALYSIS
“The greatest value of a picture is when it forces us to notice what we never expected to see.”
TEAM:
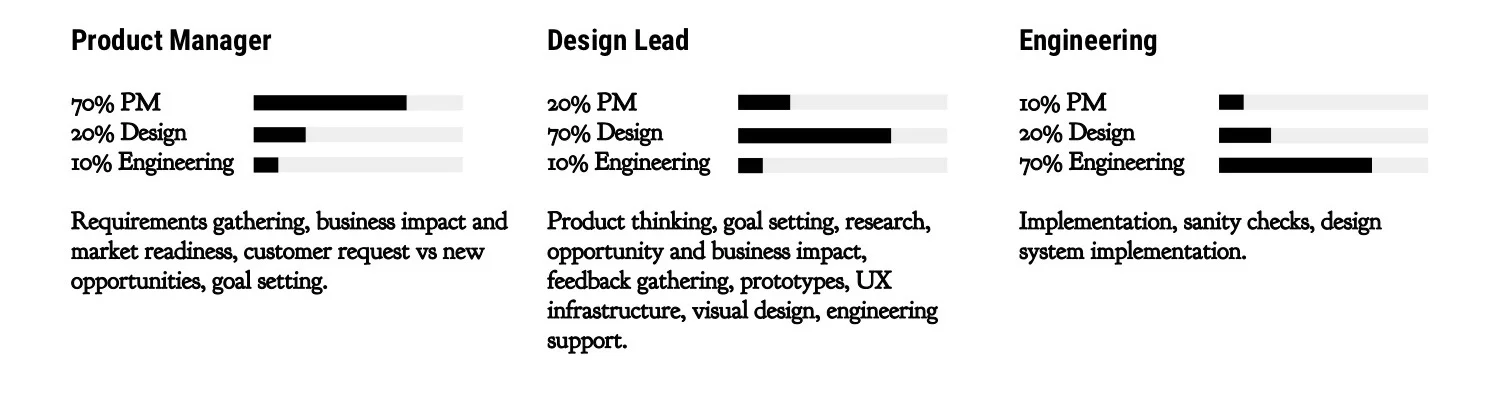
Given our size, many hats were worn and all voices were critical. Everyone participated in critiques and feedback, everyone participated in requirements gathering. Below is a breakdown of how I saw the split:
AUDIENCE:


Network Architect:
“The buck stops here.”
Focus on large scale issues and fixes
Long term analyst with focus on effects by way of changes
Focus on performance of network
Problems often mis-routed to them
Responsible for business impacts
Spends a lot of time proving problems are not the network
Network Engineer:
“I’m a network analyst, I should need a PhD to figure things out.”
Quick access to issue severity and scale.
Wants to know if he can solve it or if it requires an expert
Mostly trusts raw data
Summary helps him quickly, detailed data give him evidence
Real-time data is important but often looks for smoking gun
PROBLEM:
Working with our product manager and sales engineers, we discovered that this section of our app was not highly trafficked and for good reason; a lot of information got lost in translation. Some of our discoveries:
Some pages were going completely unused.
Data was repetitive and sometimes too difficult to derive meaning from.
There was no reason to enter deep analysis if you weren't an expert.
No follow through to incidents when examining a root cause.
No subsequent steps were offered after Voyance surfaced an issue in their network.
Inability to determine if an issue was caused by a client or the network when a client was flagged as problematic.
Filtering was difficult.
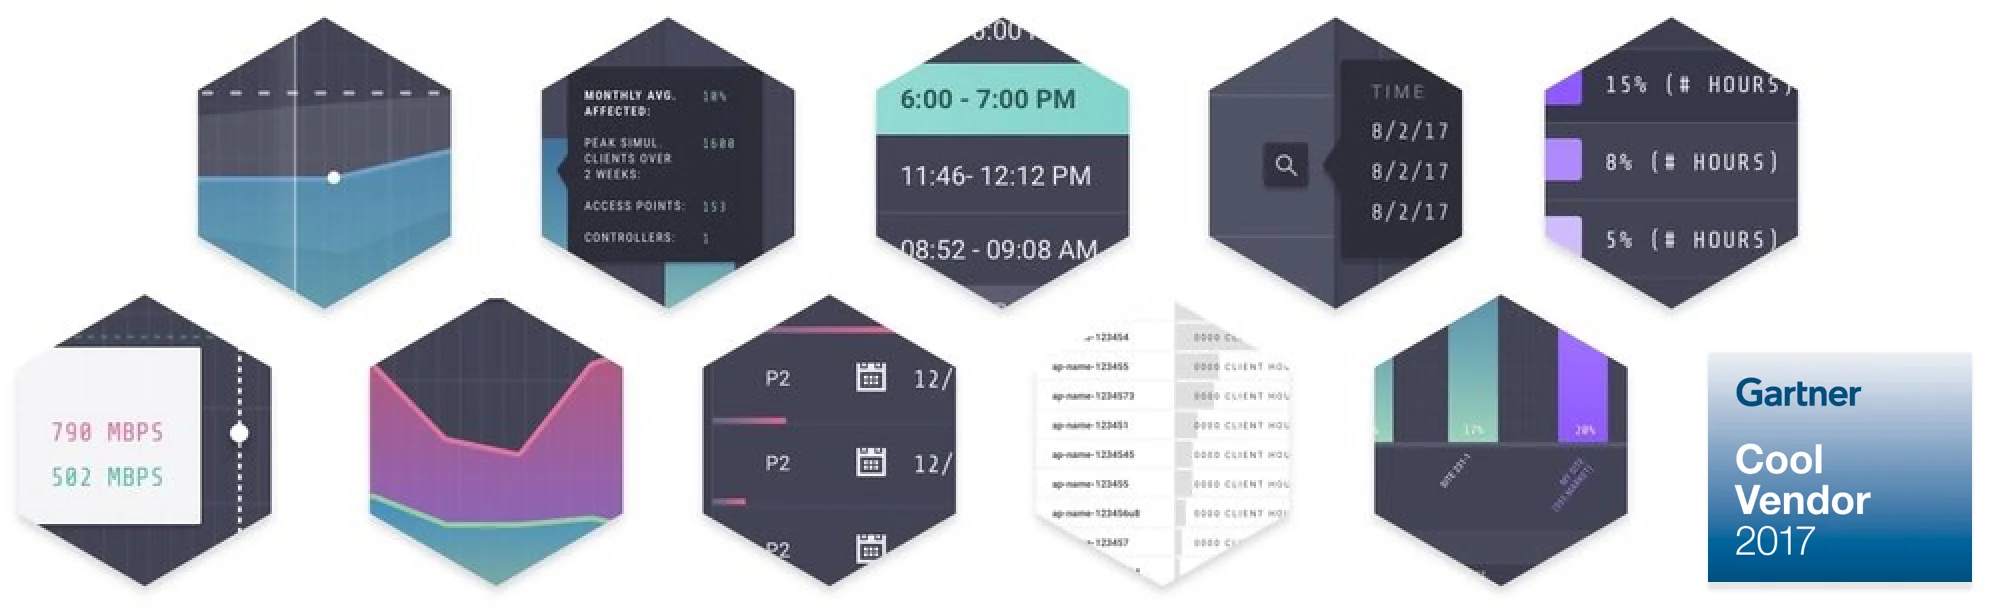
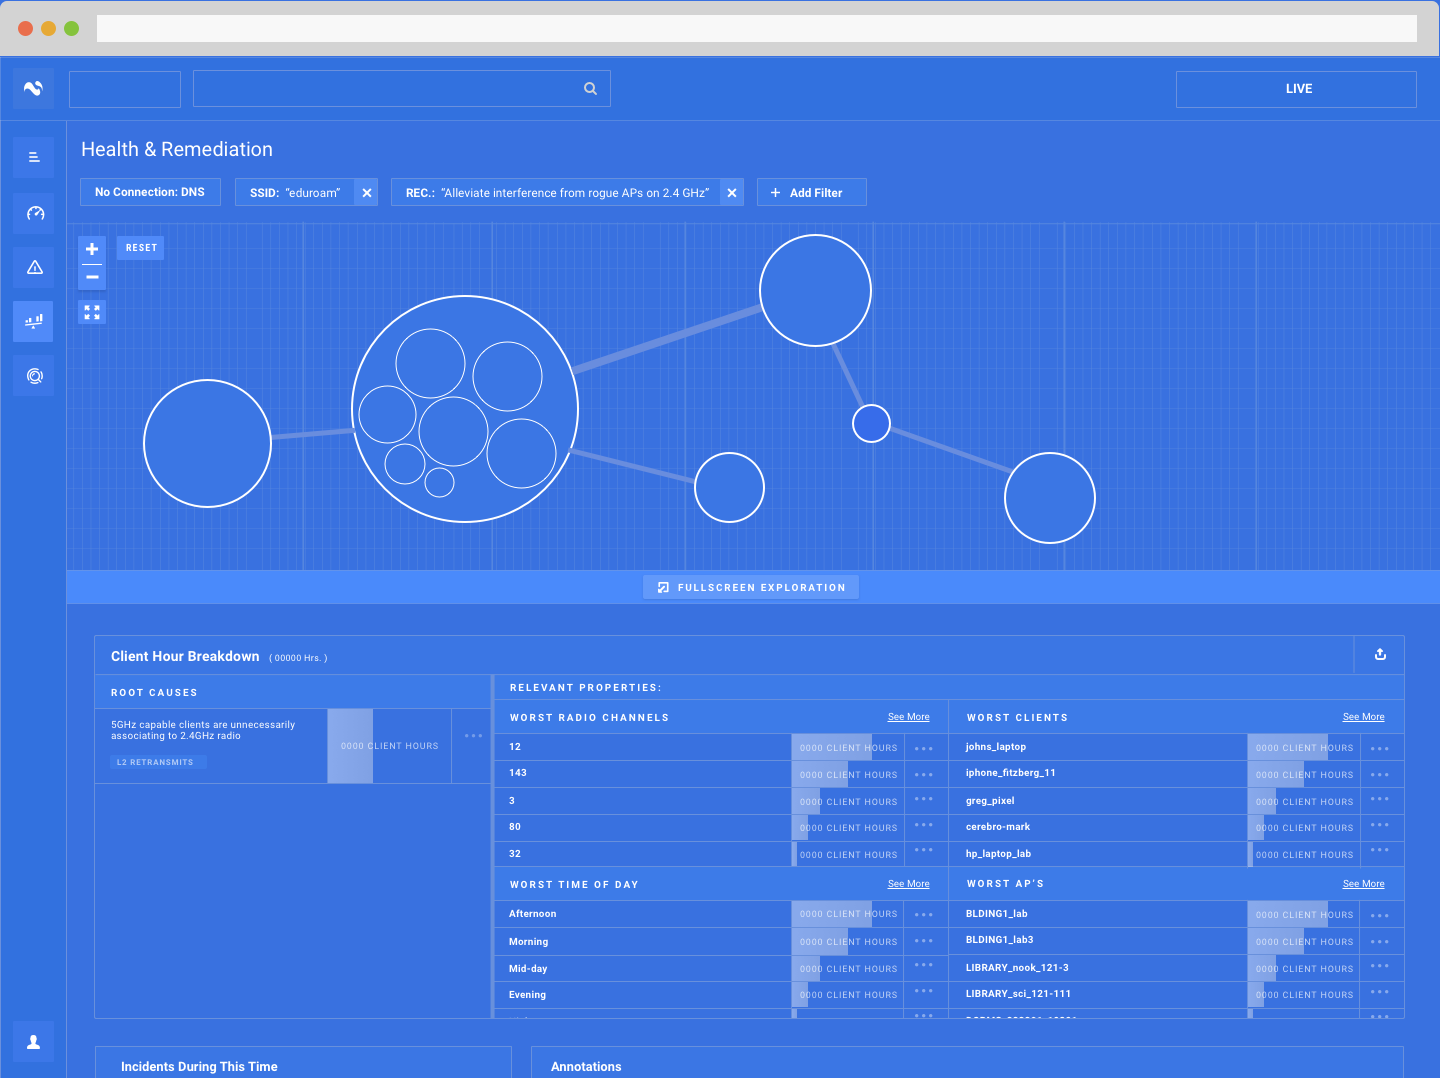
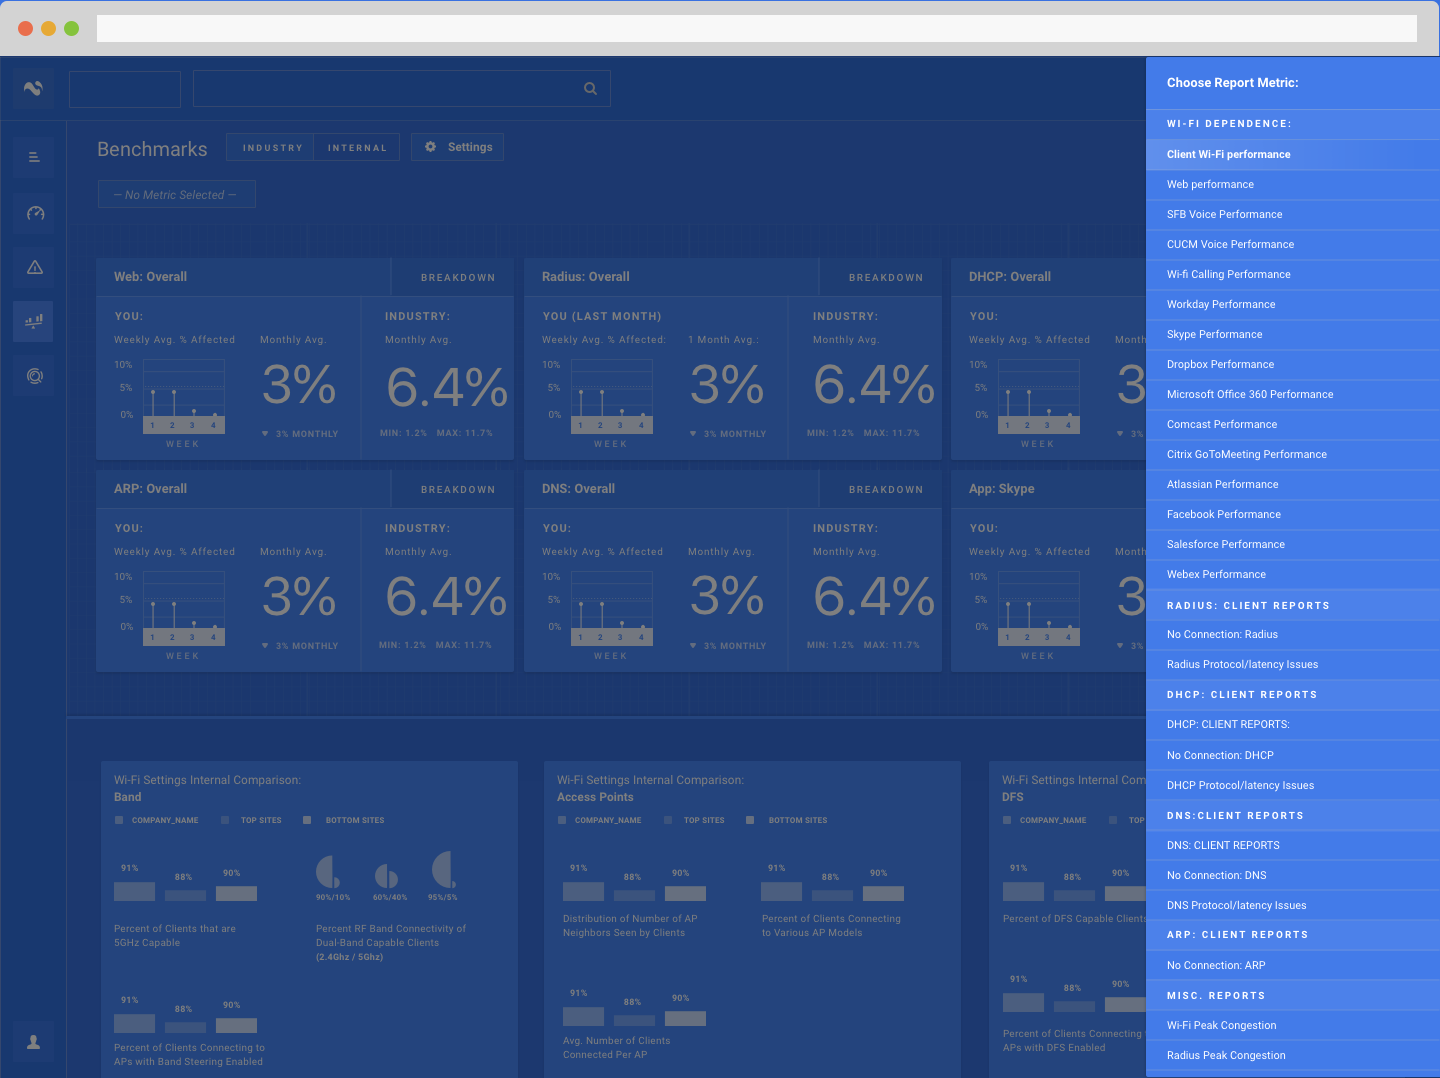
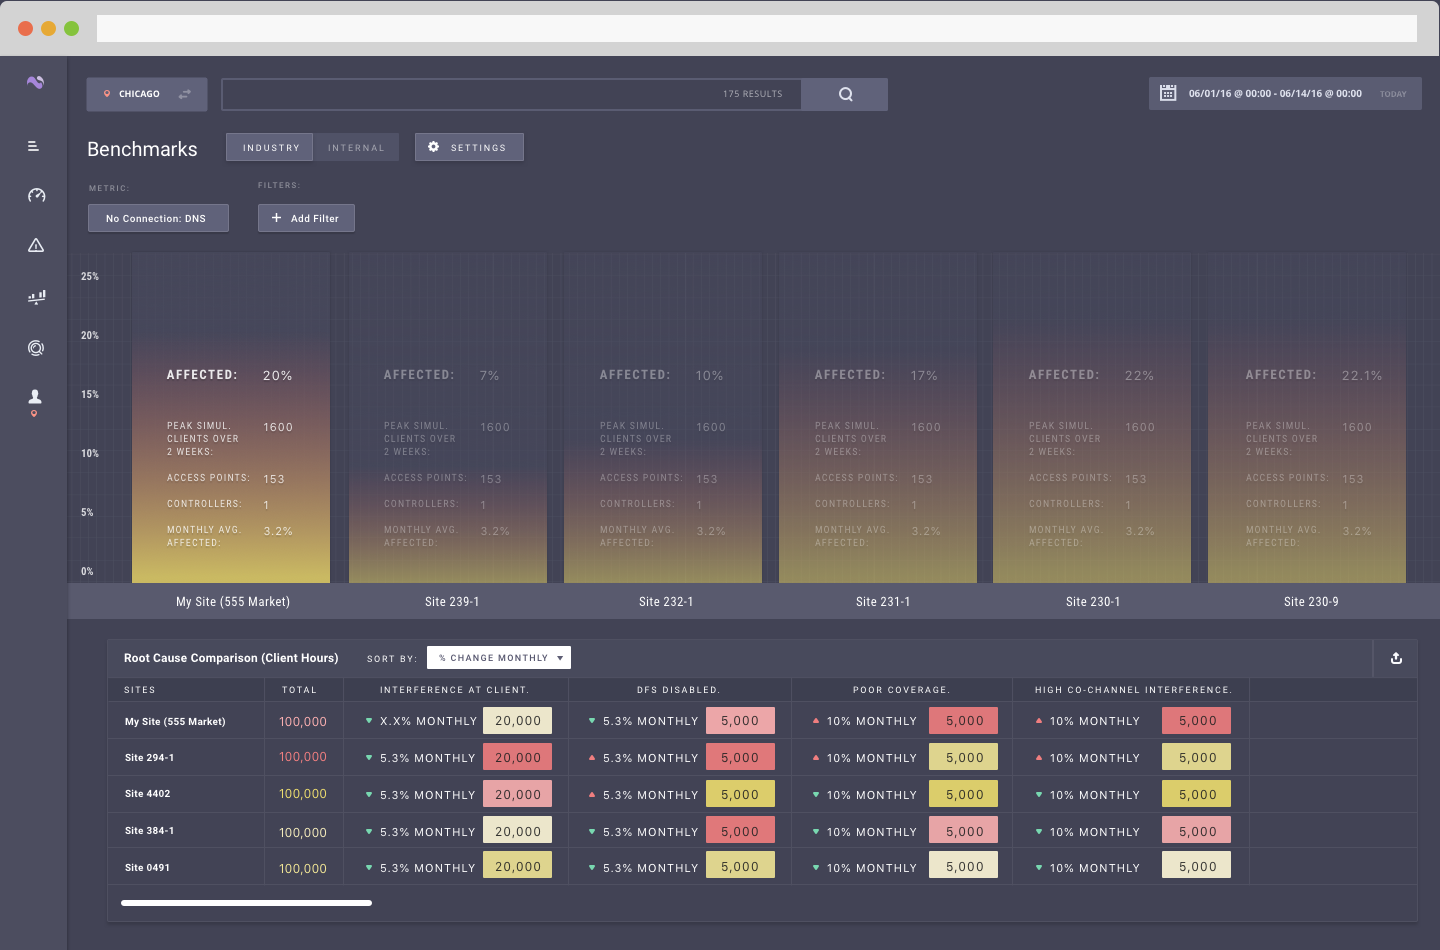
Below is the before picture of this section:
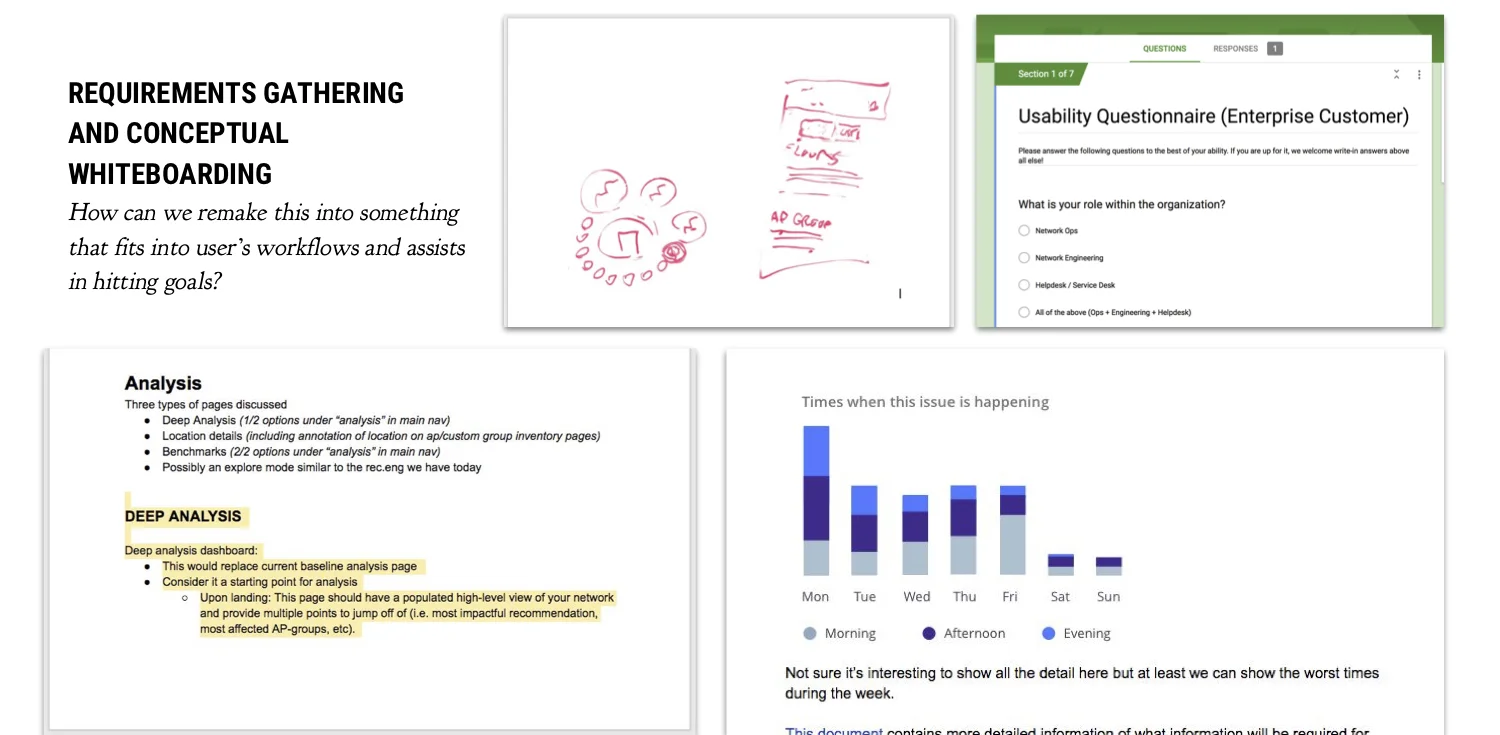
REQUIREMENTS:
Be it through face to face interviews or google surveys, we tried to gather as many data points as we could to understand the problems we were facing:
INFORMATION ARCHITECTURE:
Workflows in and out of the new analysis section would need to be considered as well. There was still a strong need for it to remain sectioned off, regardless of it’s inevitable skeletal restructure.
So much of it was designed in a silo and added piecemeal that it became a dumping ground for data with copious dead ends. Once we got a handle on what there was to work with, we effectively derived sections with a thesis in mind for each:
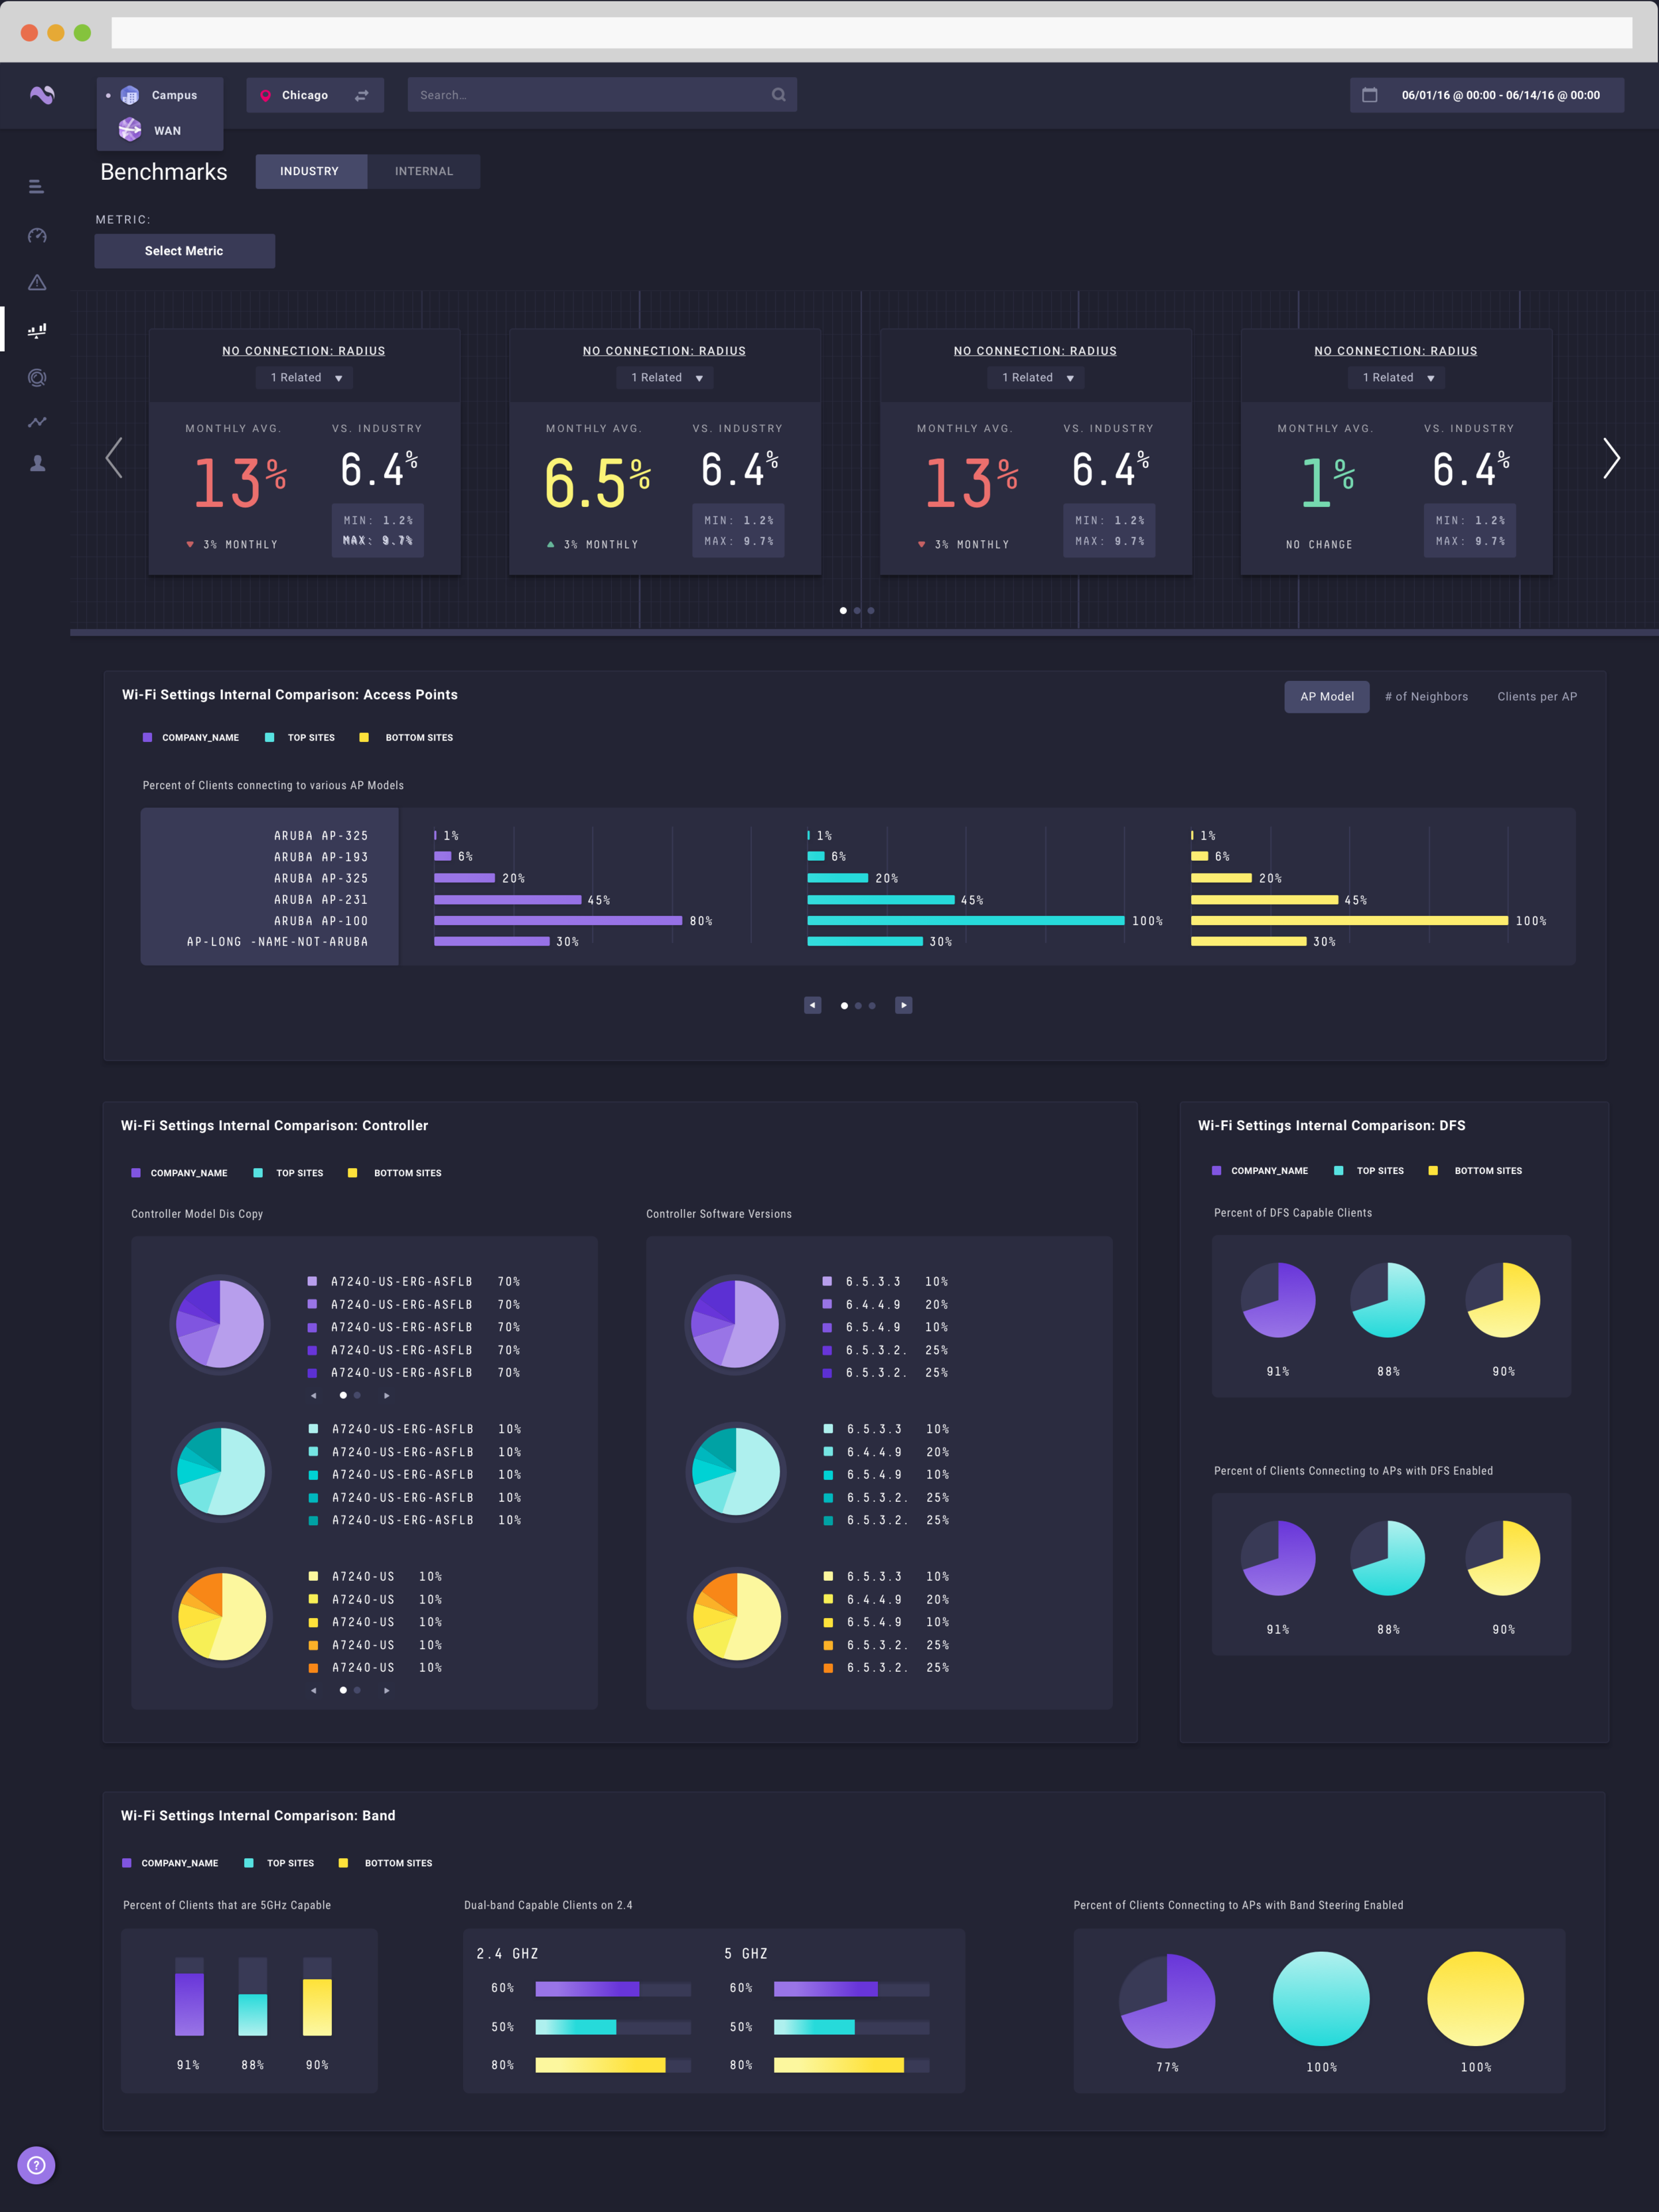
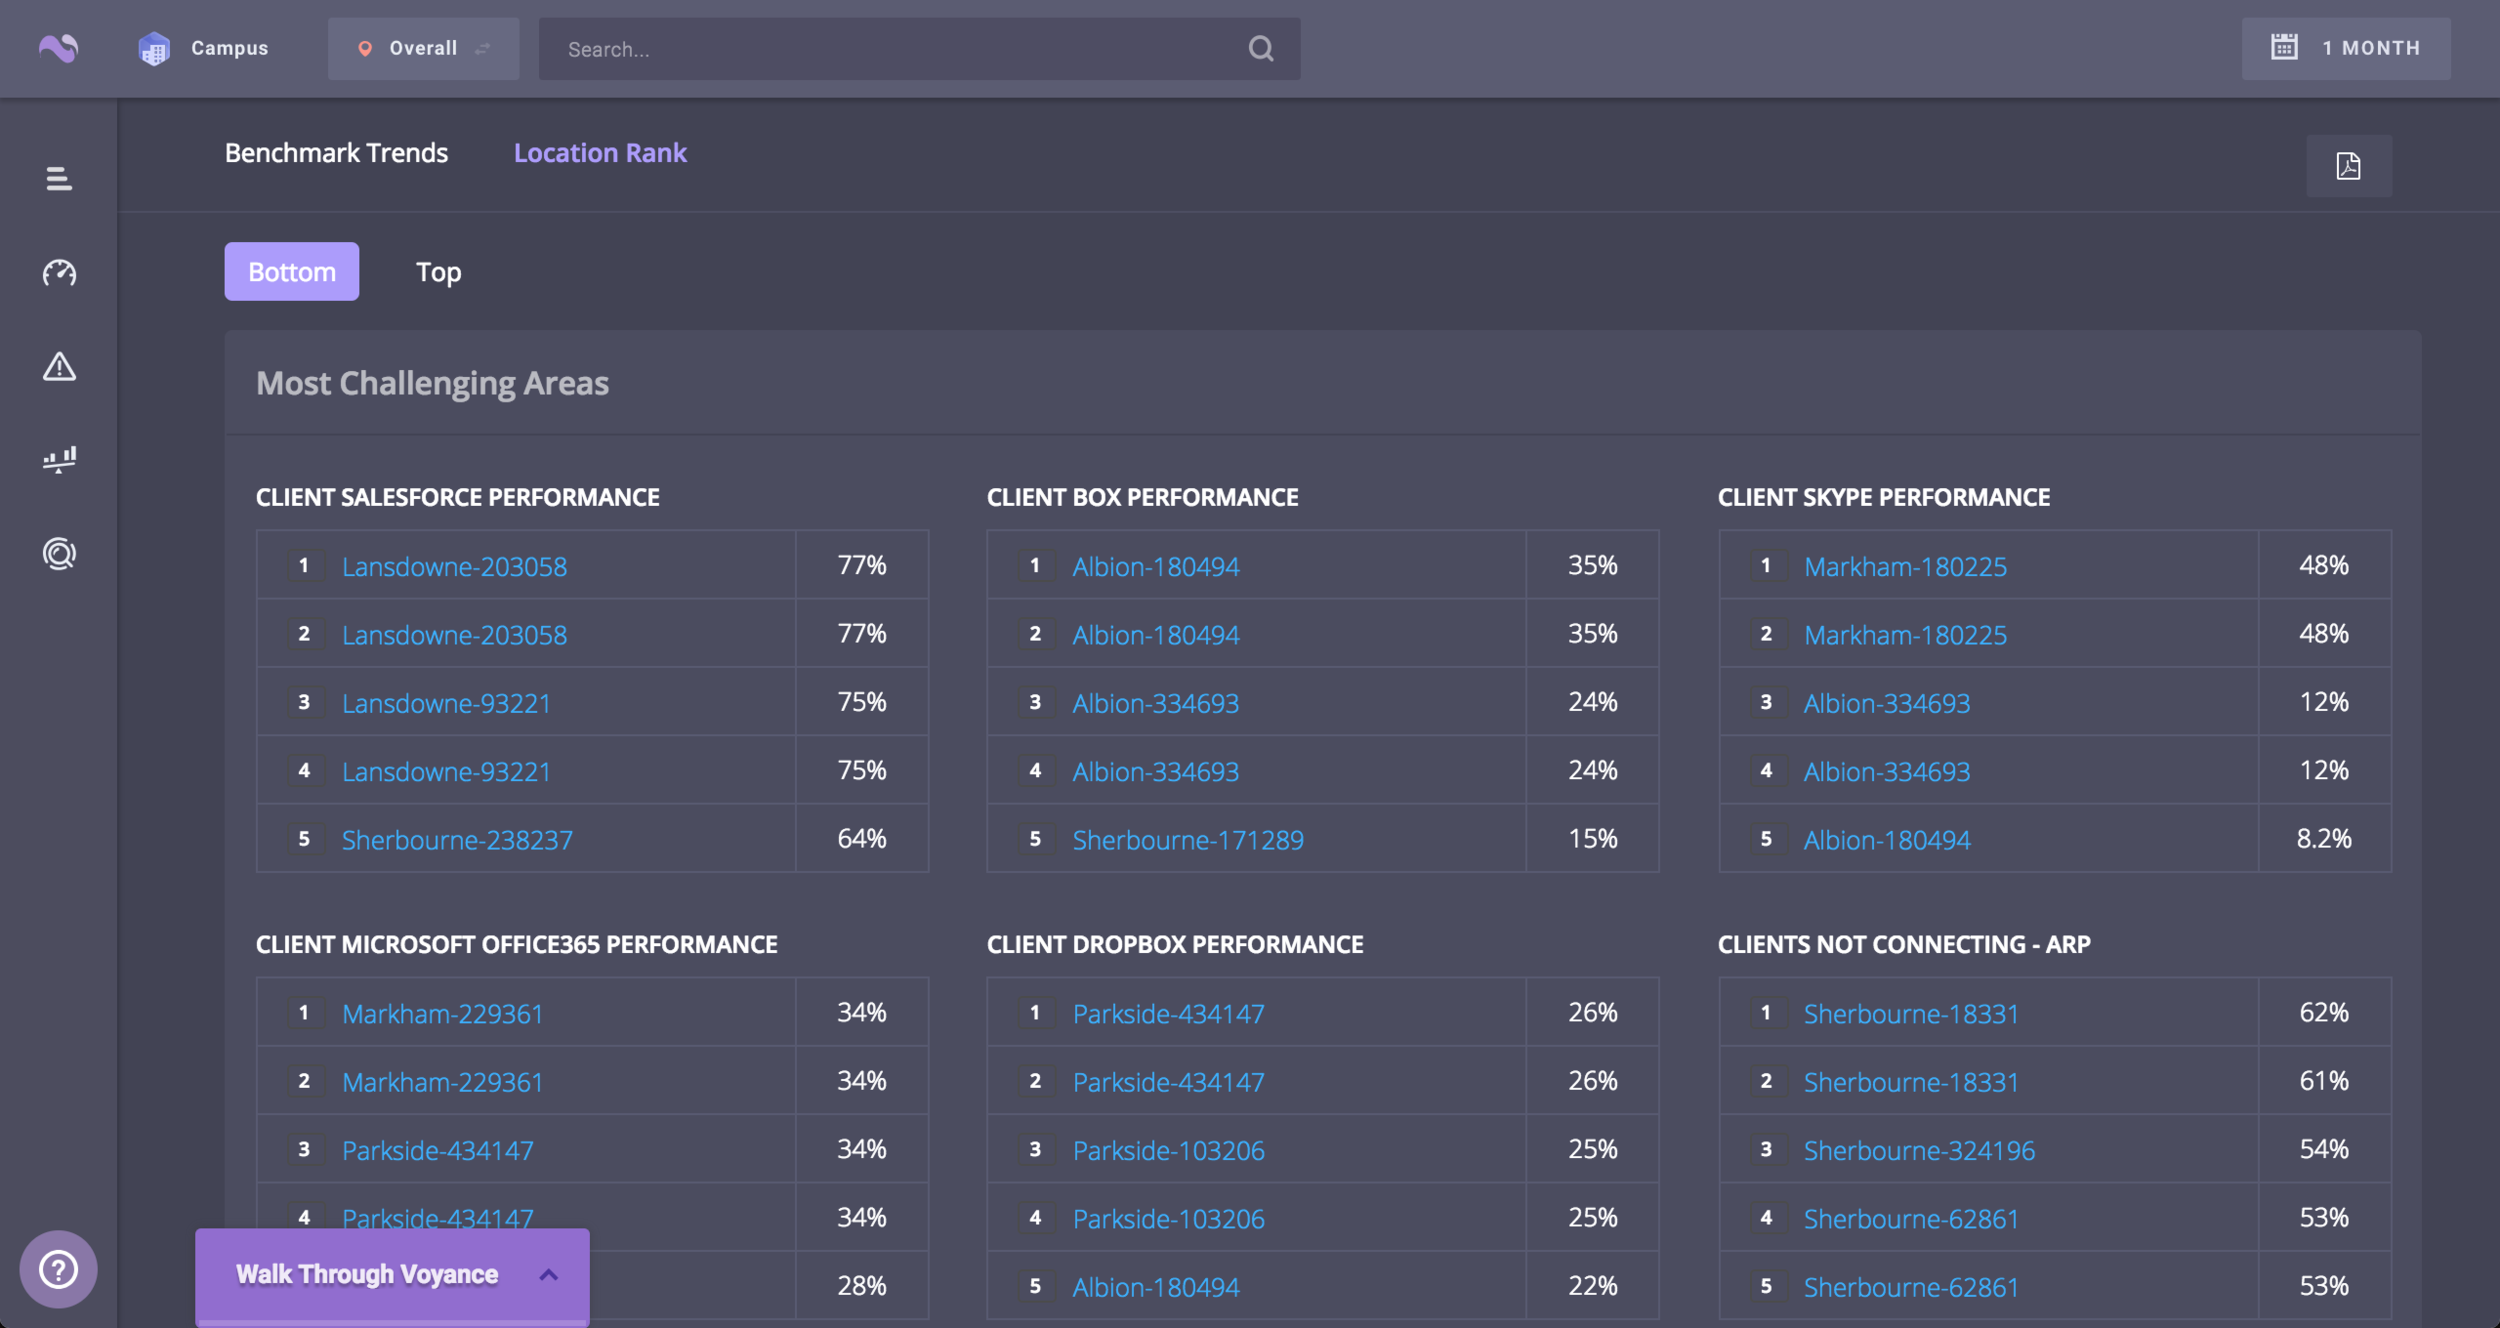
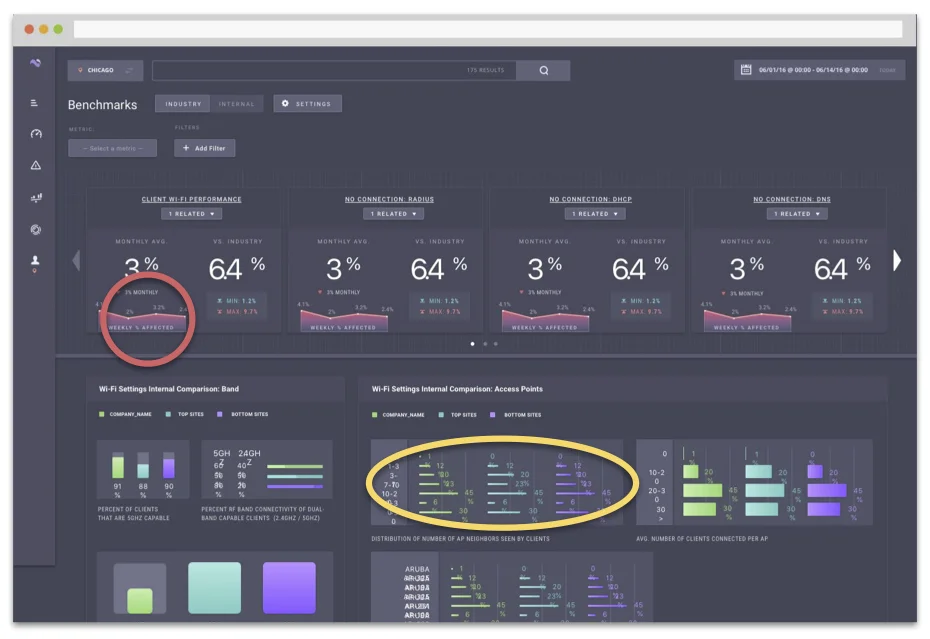
BENCHMARKS: A
Thesis: I want to see how my site is performing as compared to other sites like it.
Single place for all things comparative.
Compare internally and externally
Comparison over additional metrics other than key KPI’s
Clearly delineating wi-fi performance vs other metrics and root causes
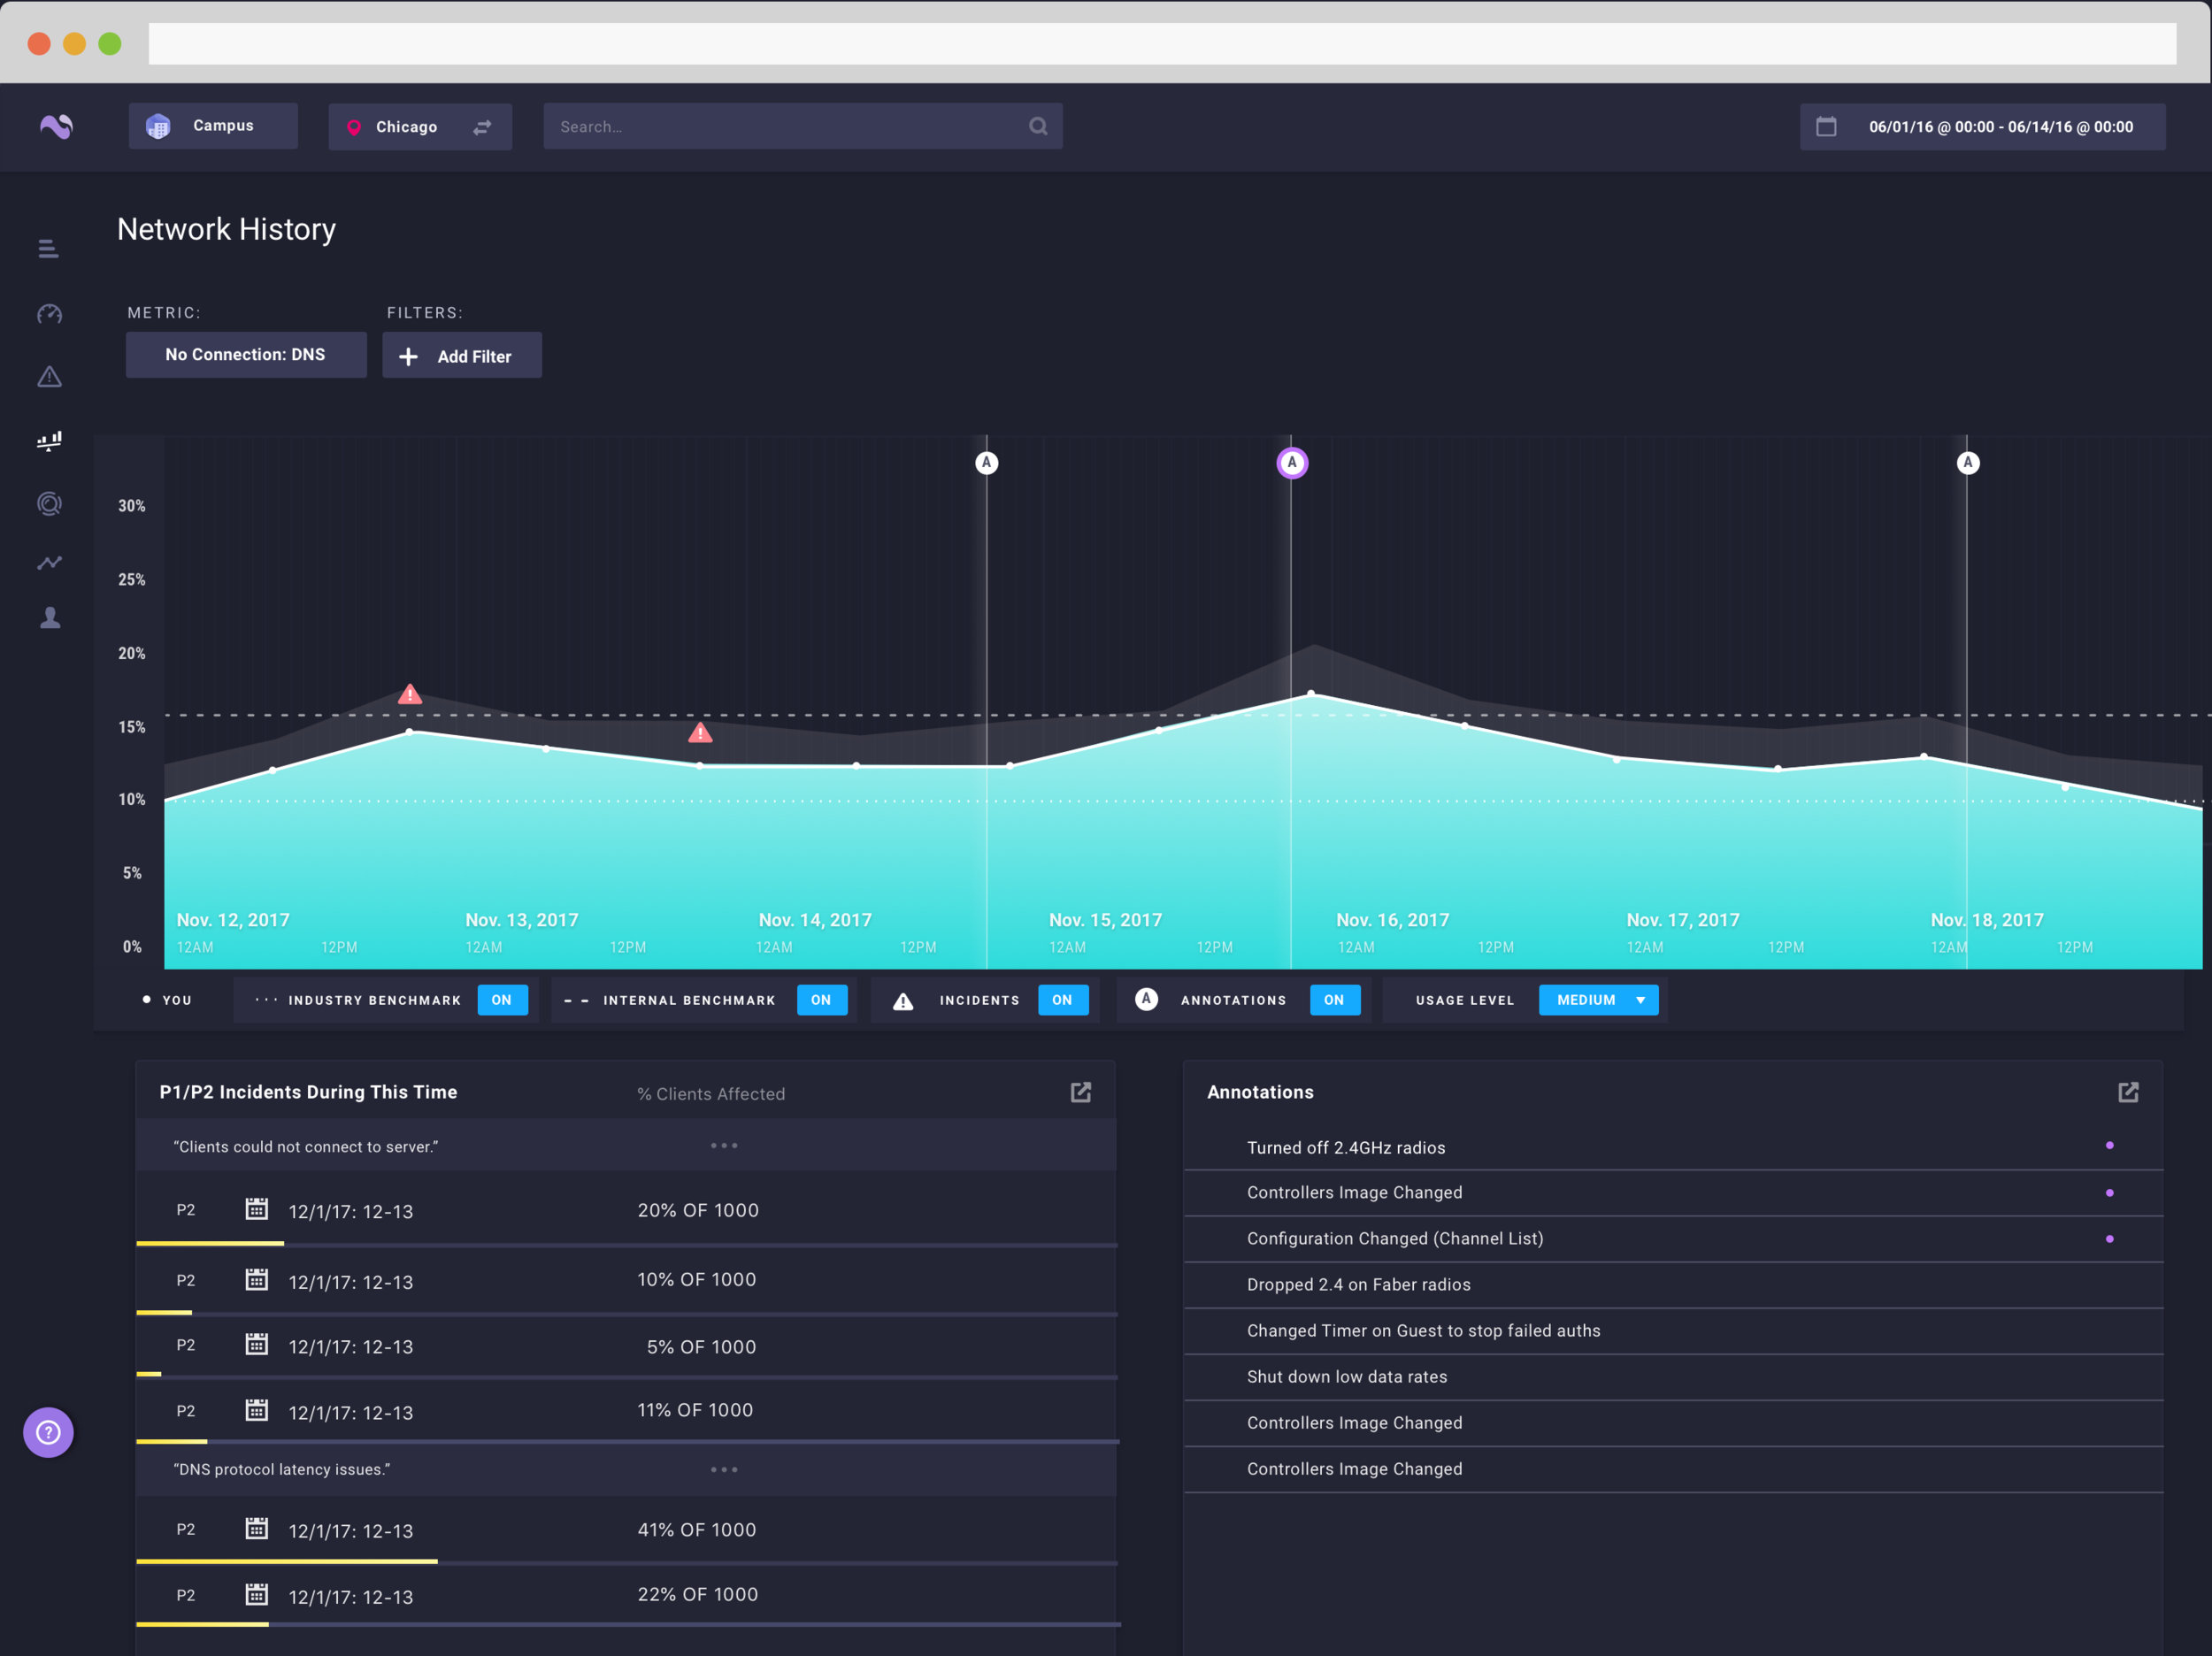
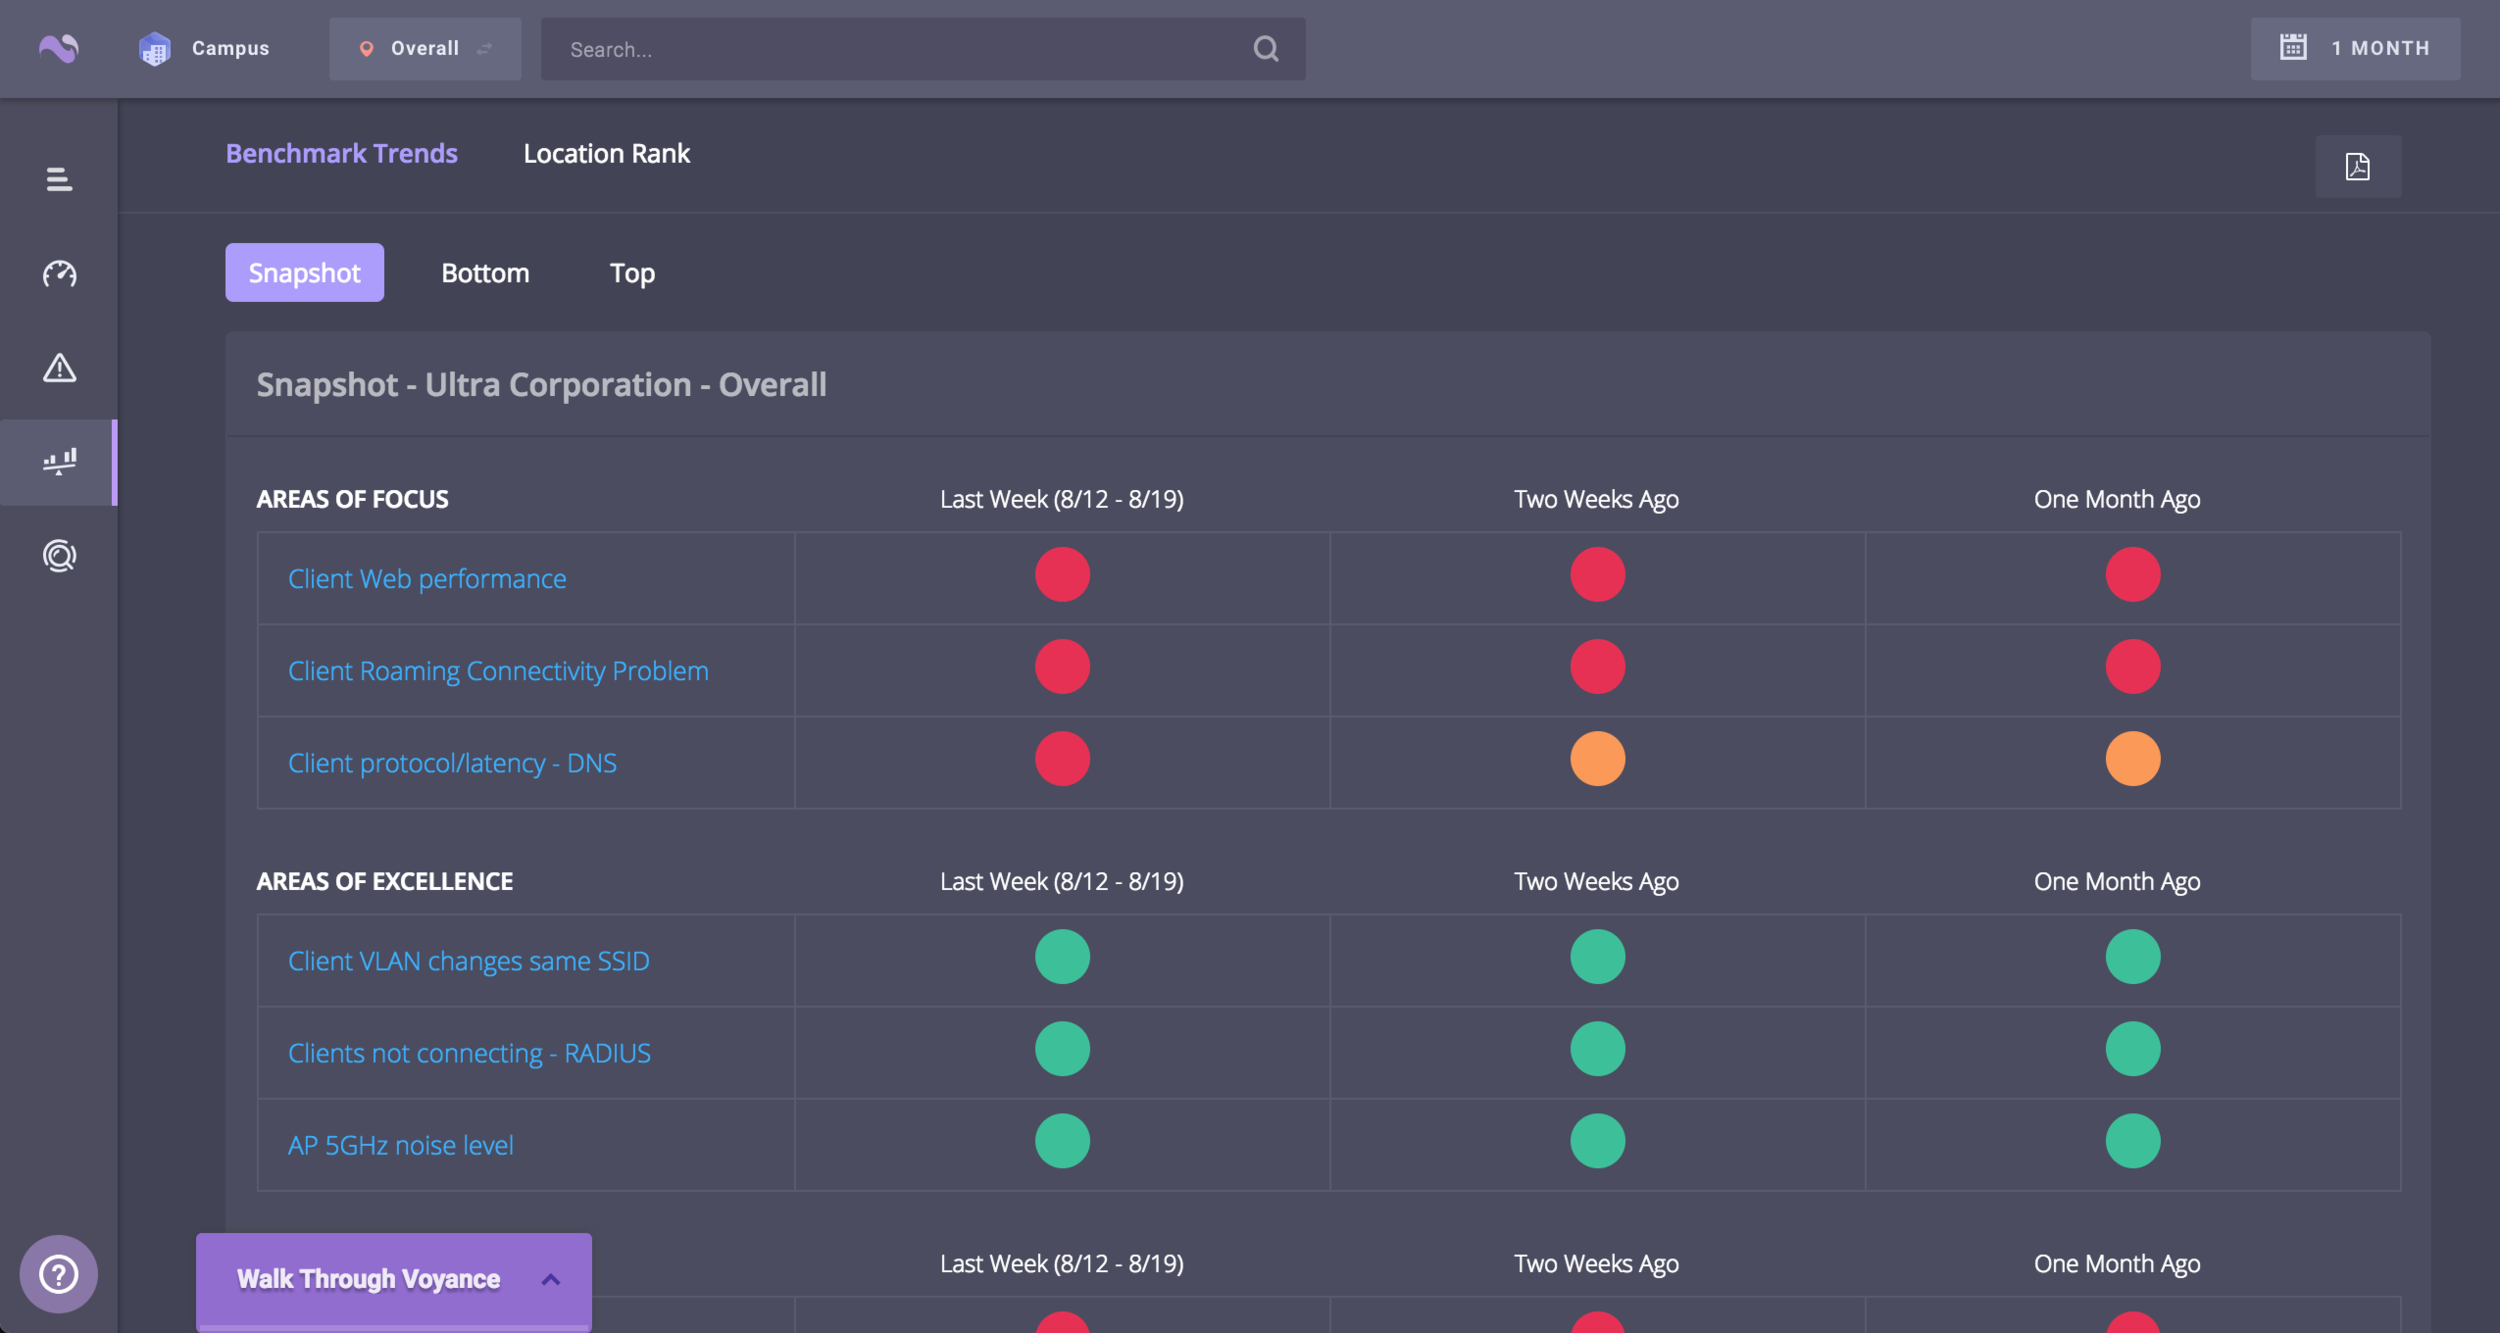
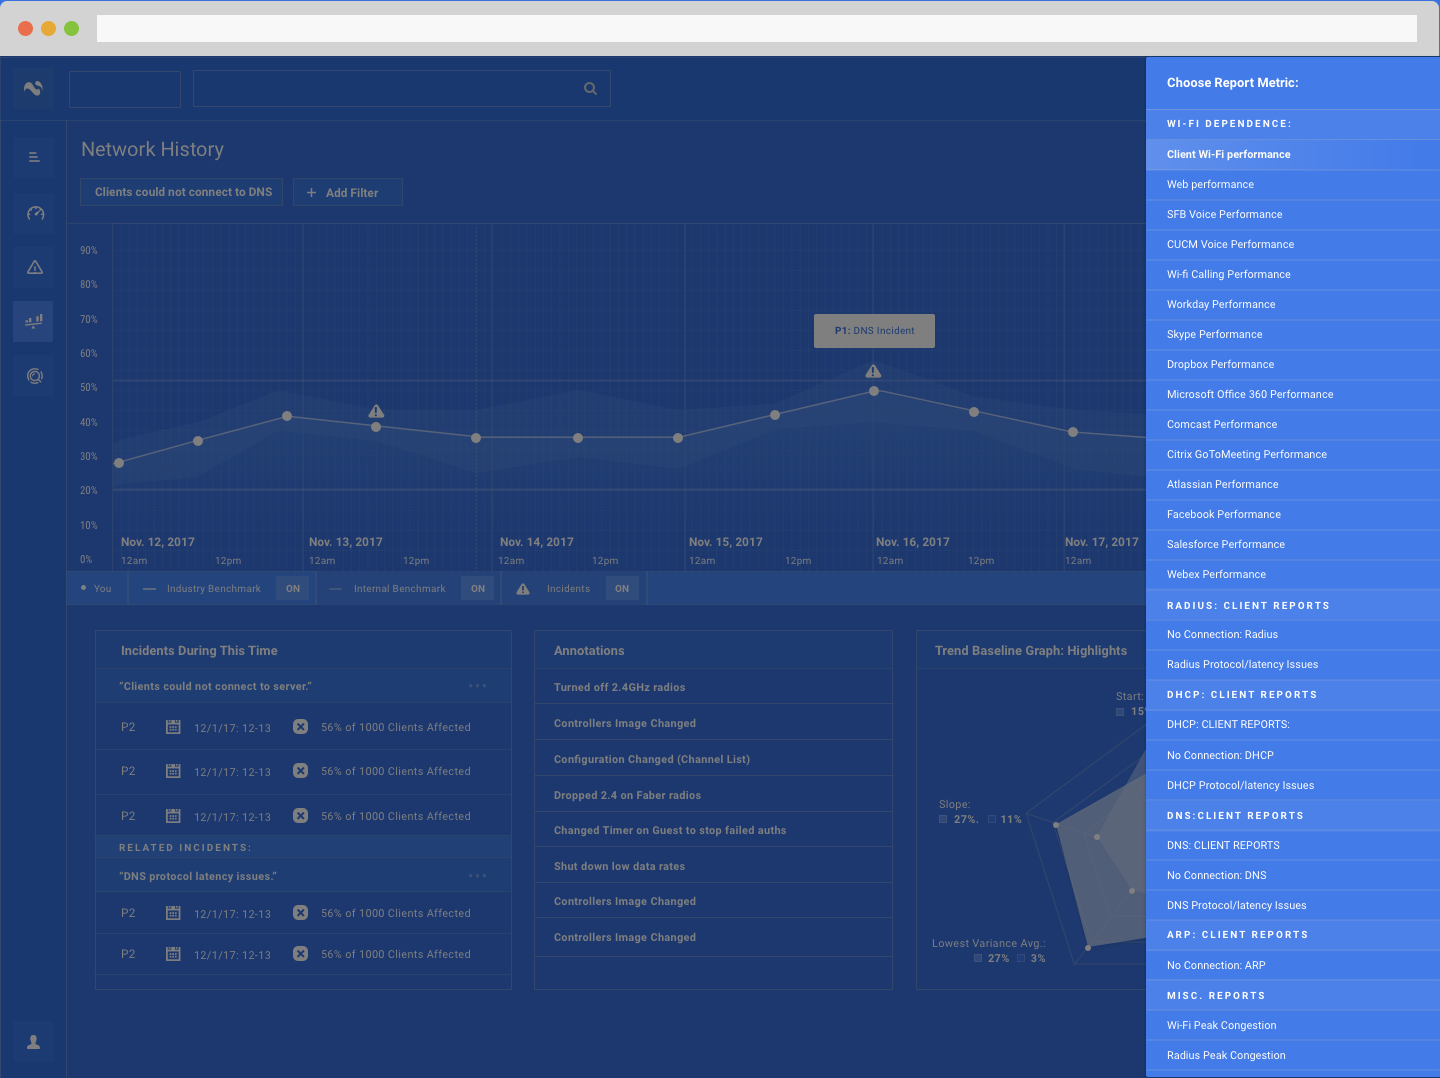
HISTORY:
Thesis: I want to know how my site has performed over a given amount of time while being able to track the effects of my changes.
One stop shop for how your network has performed historically
Retain baseline UI but provide a faster way to measure against an industry average
Clearly couple incidents and annotations with changes in performance
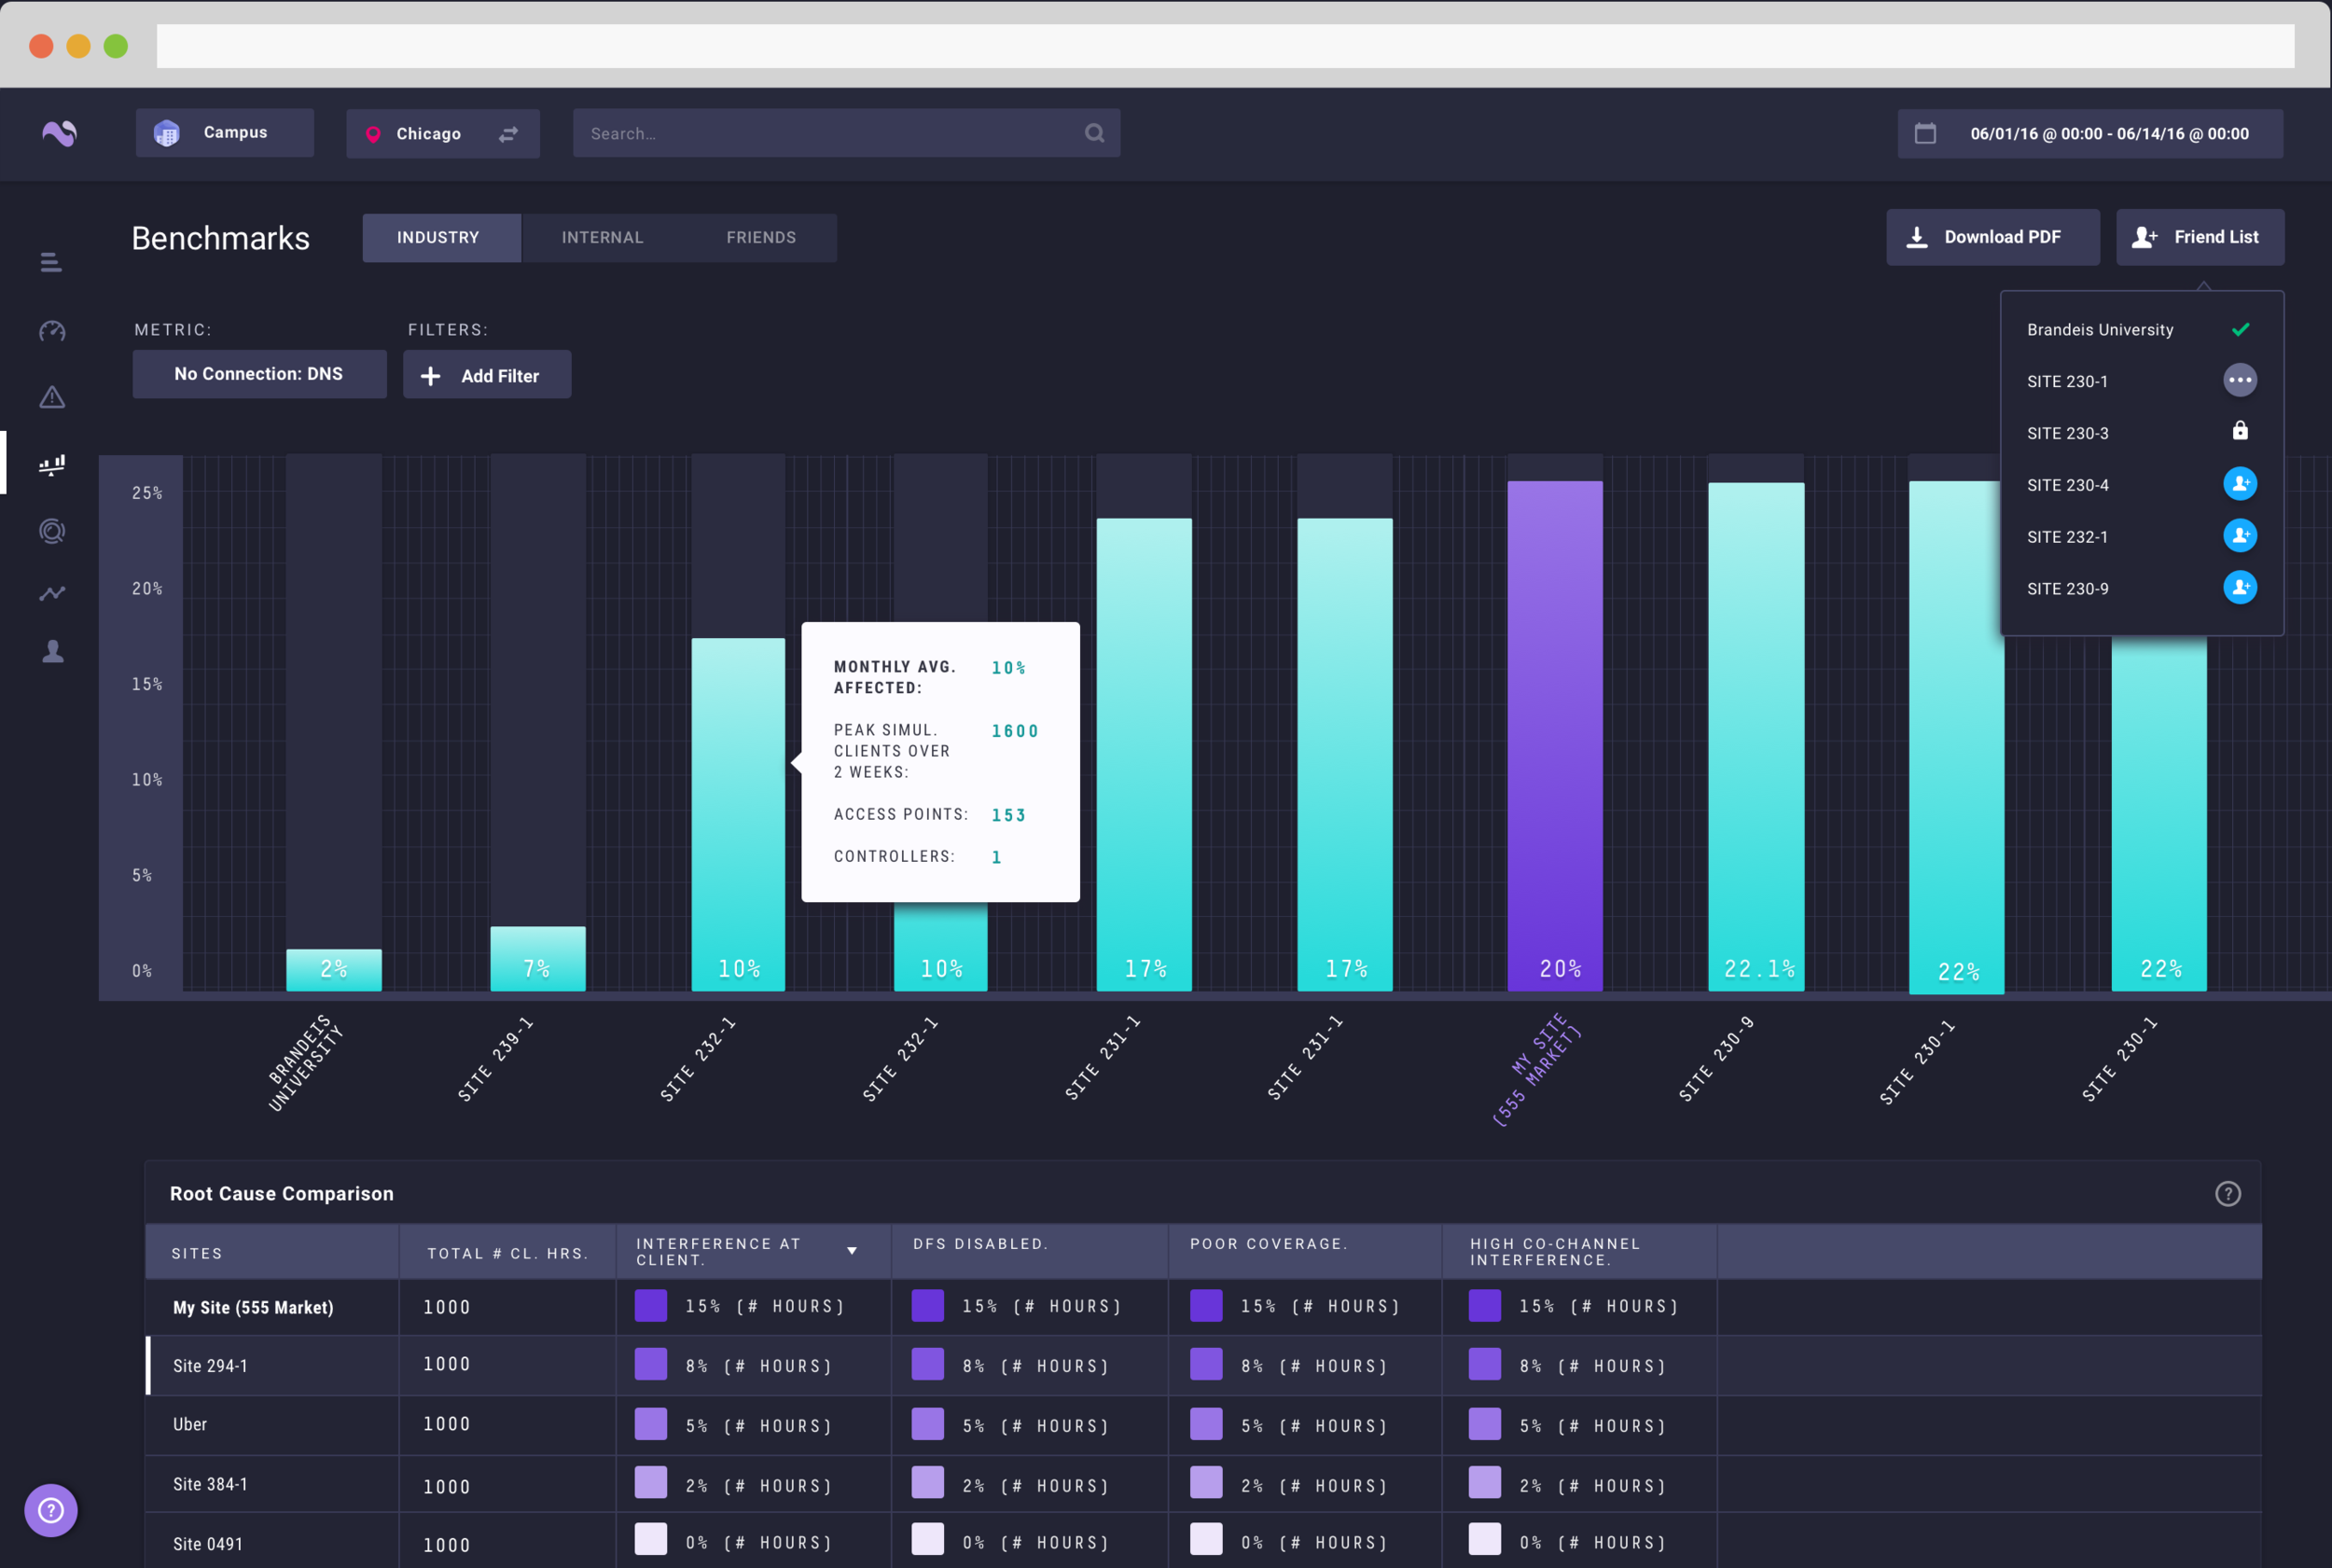
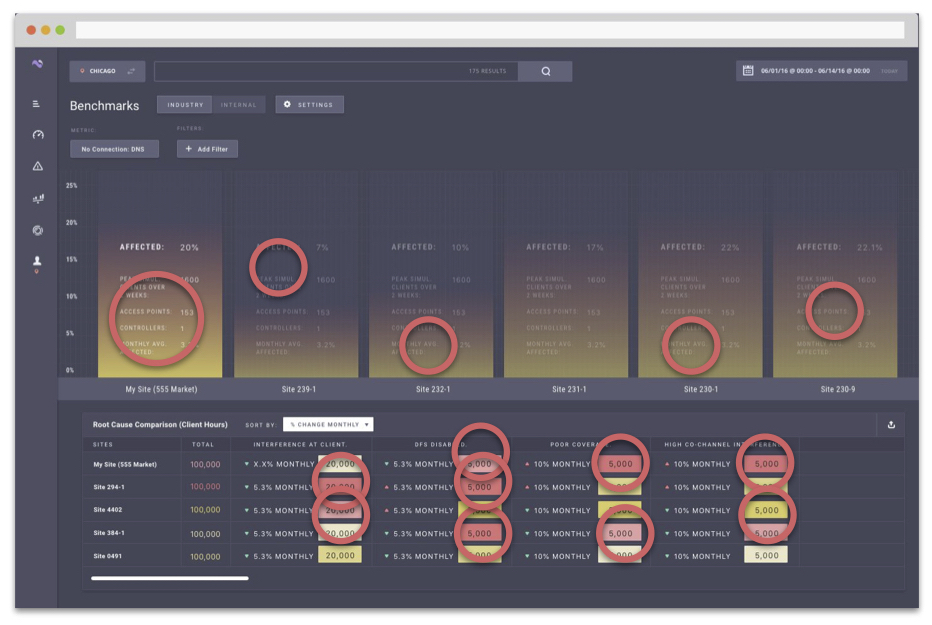
BENCHMARKS: B (DEEP DIVE)
Thesis: I want to zone in on one single type of metric and see how I compare in a list of other sites like mine.
See network compared by one specific metric
Measure up against other sites of similar size, internally and externally
See common or uncommon route causes to add actionability
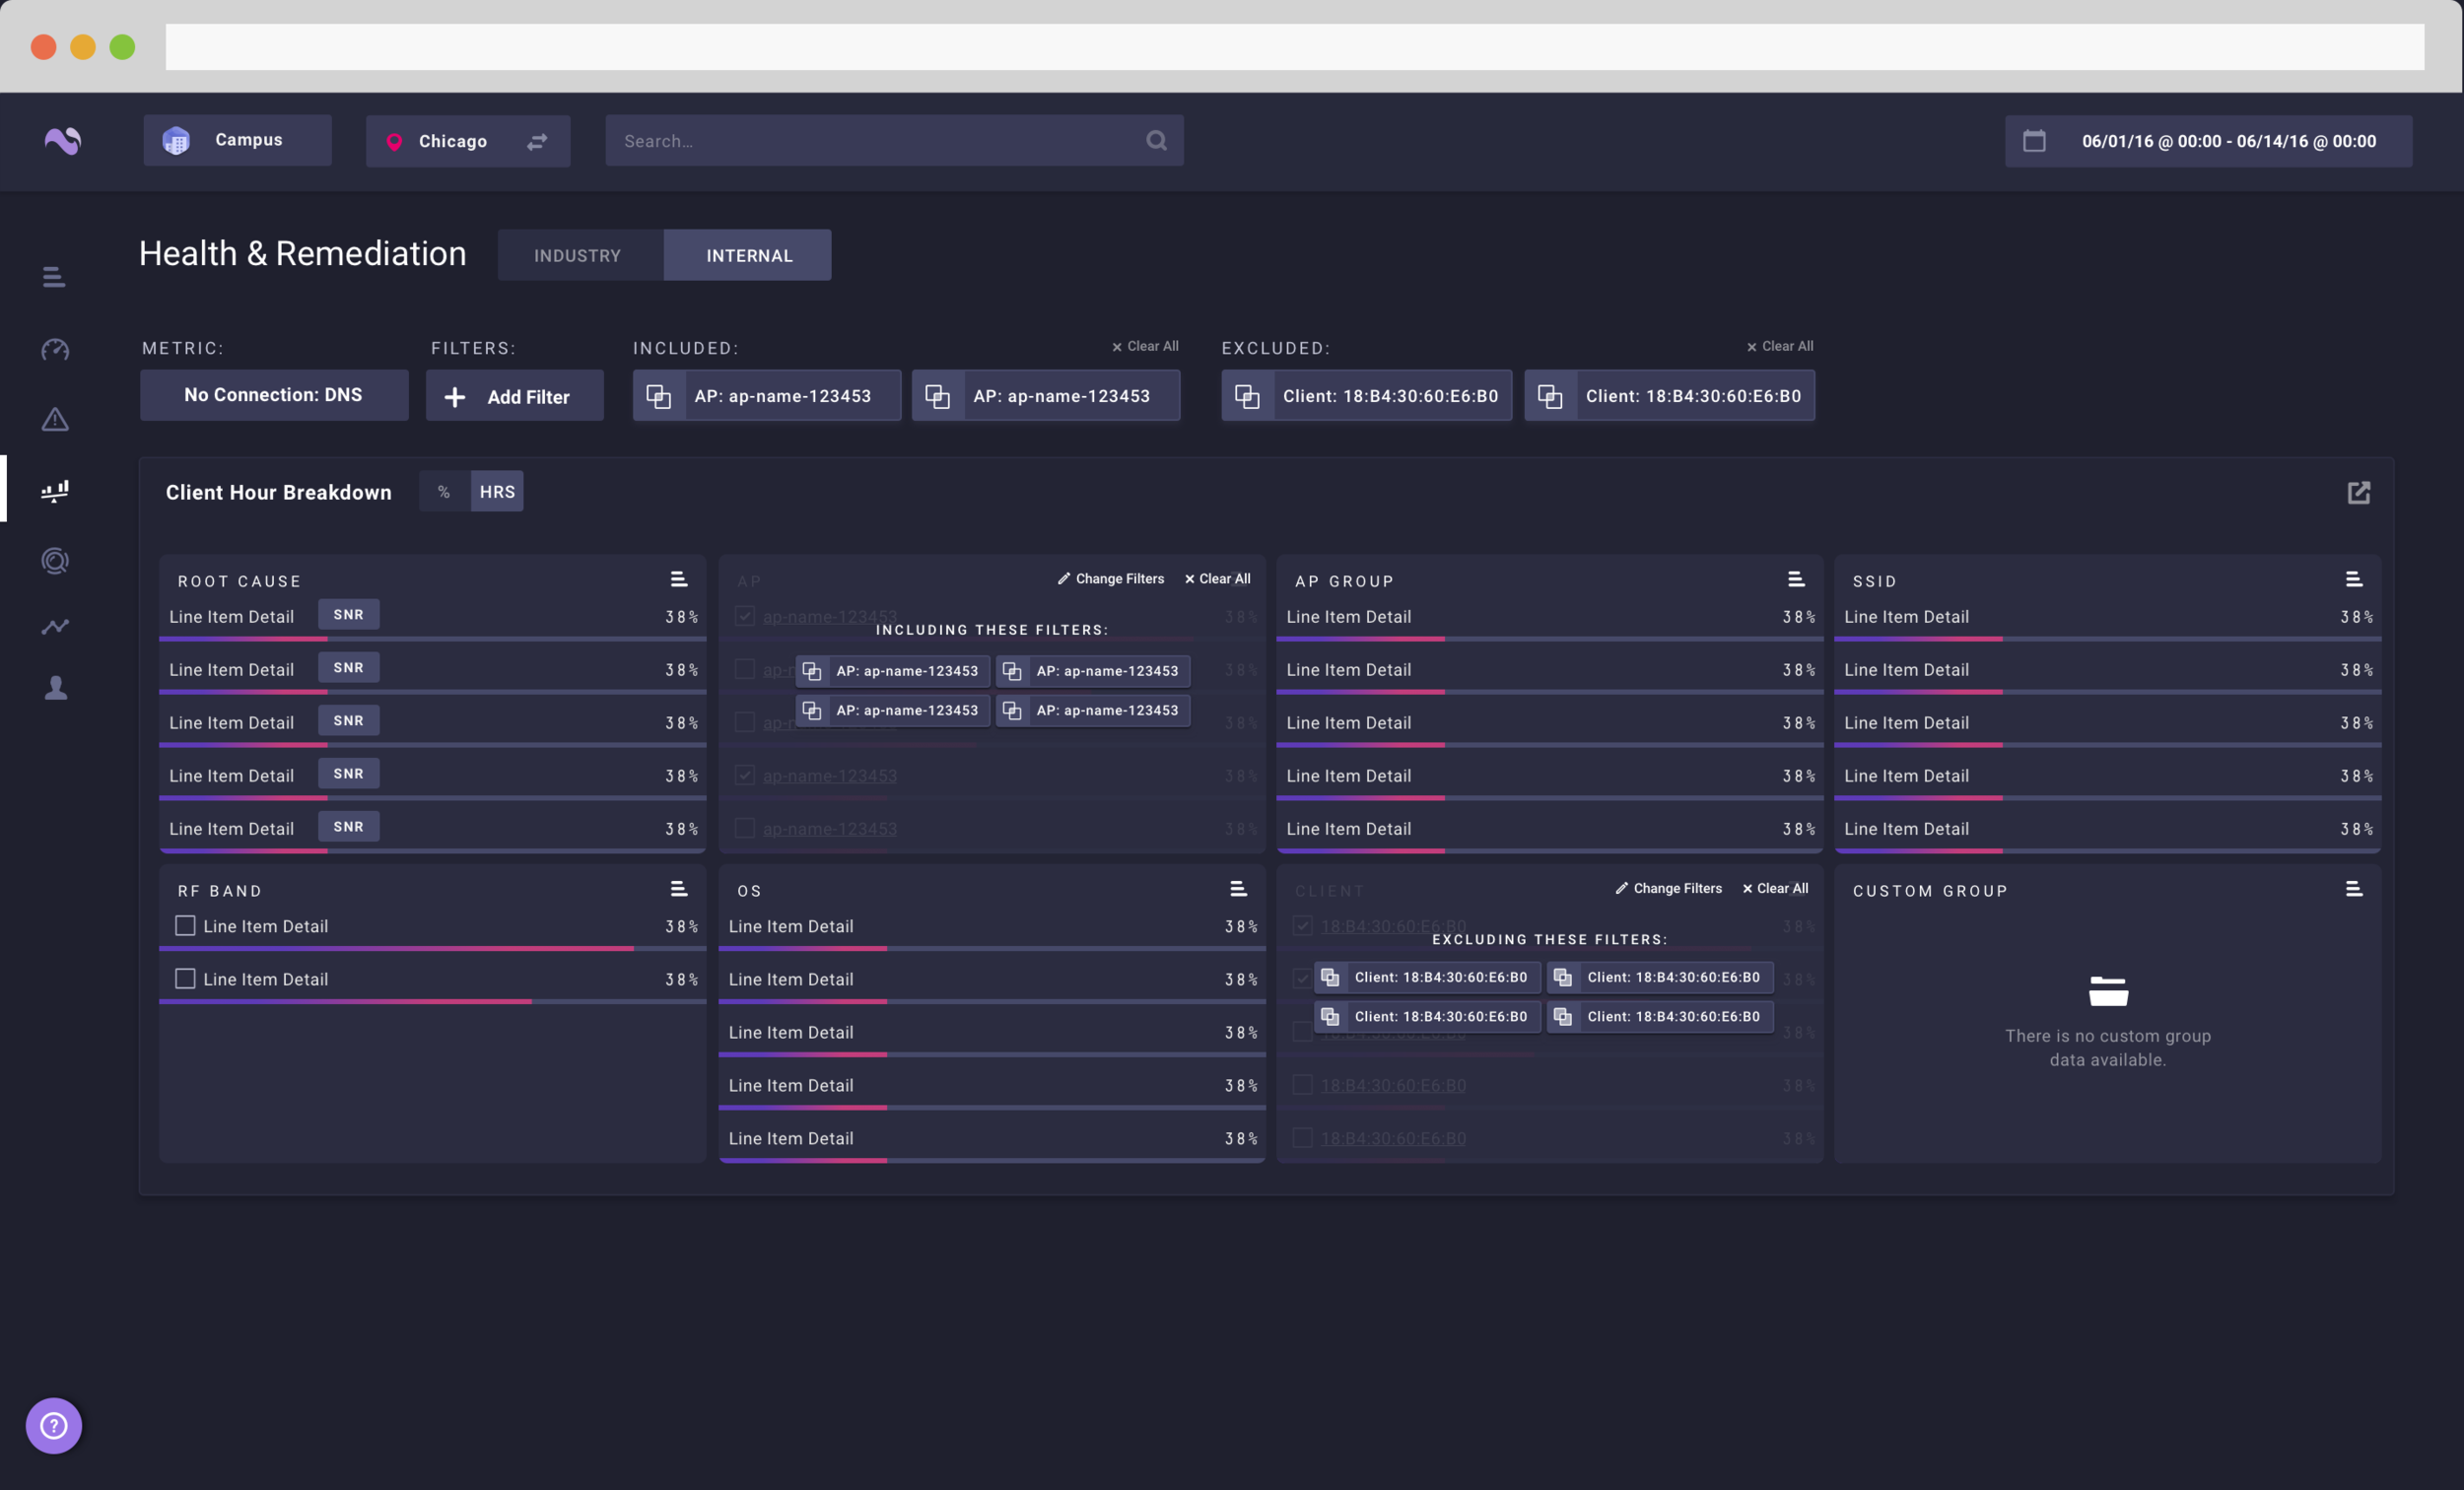
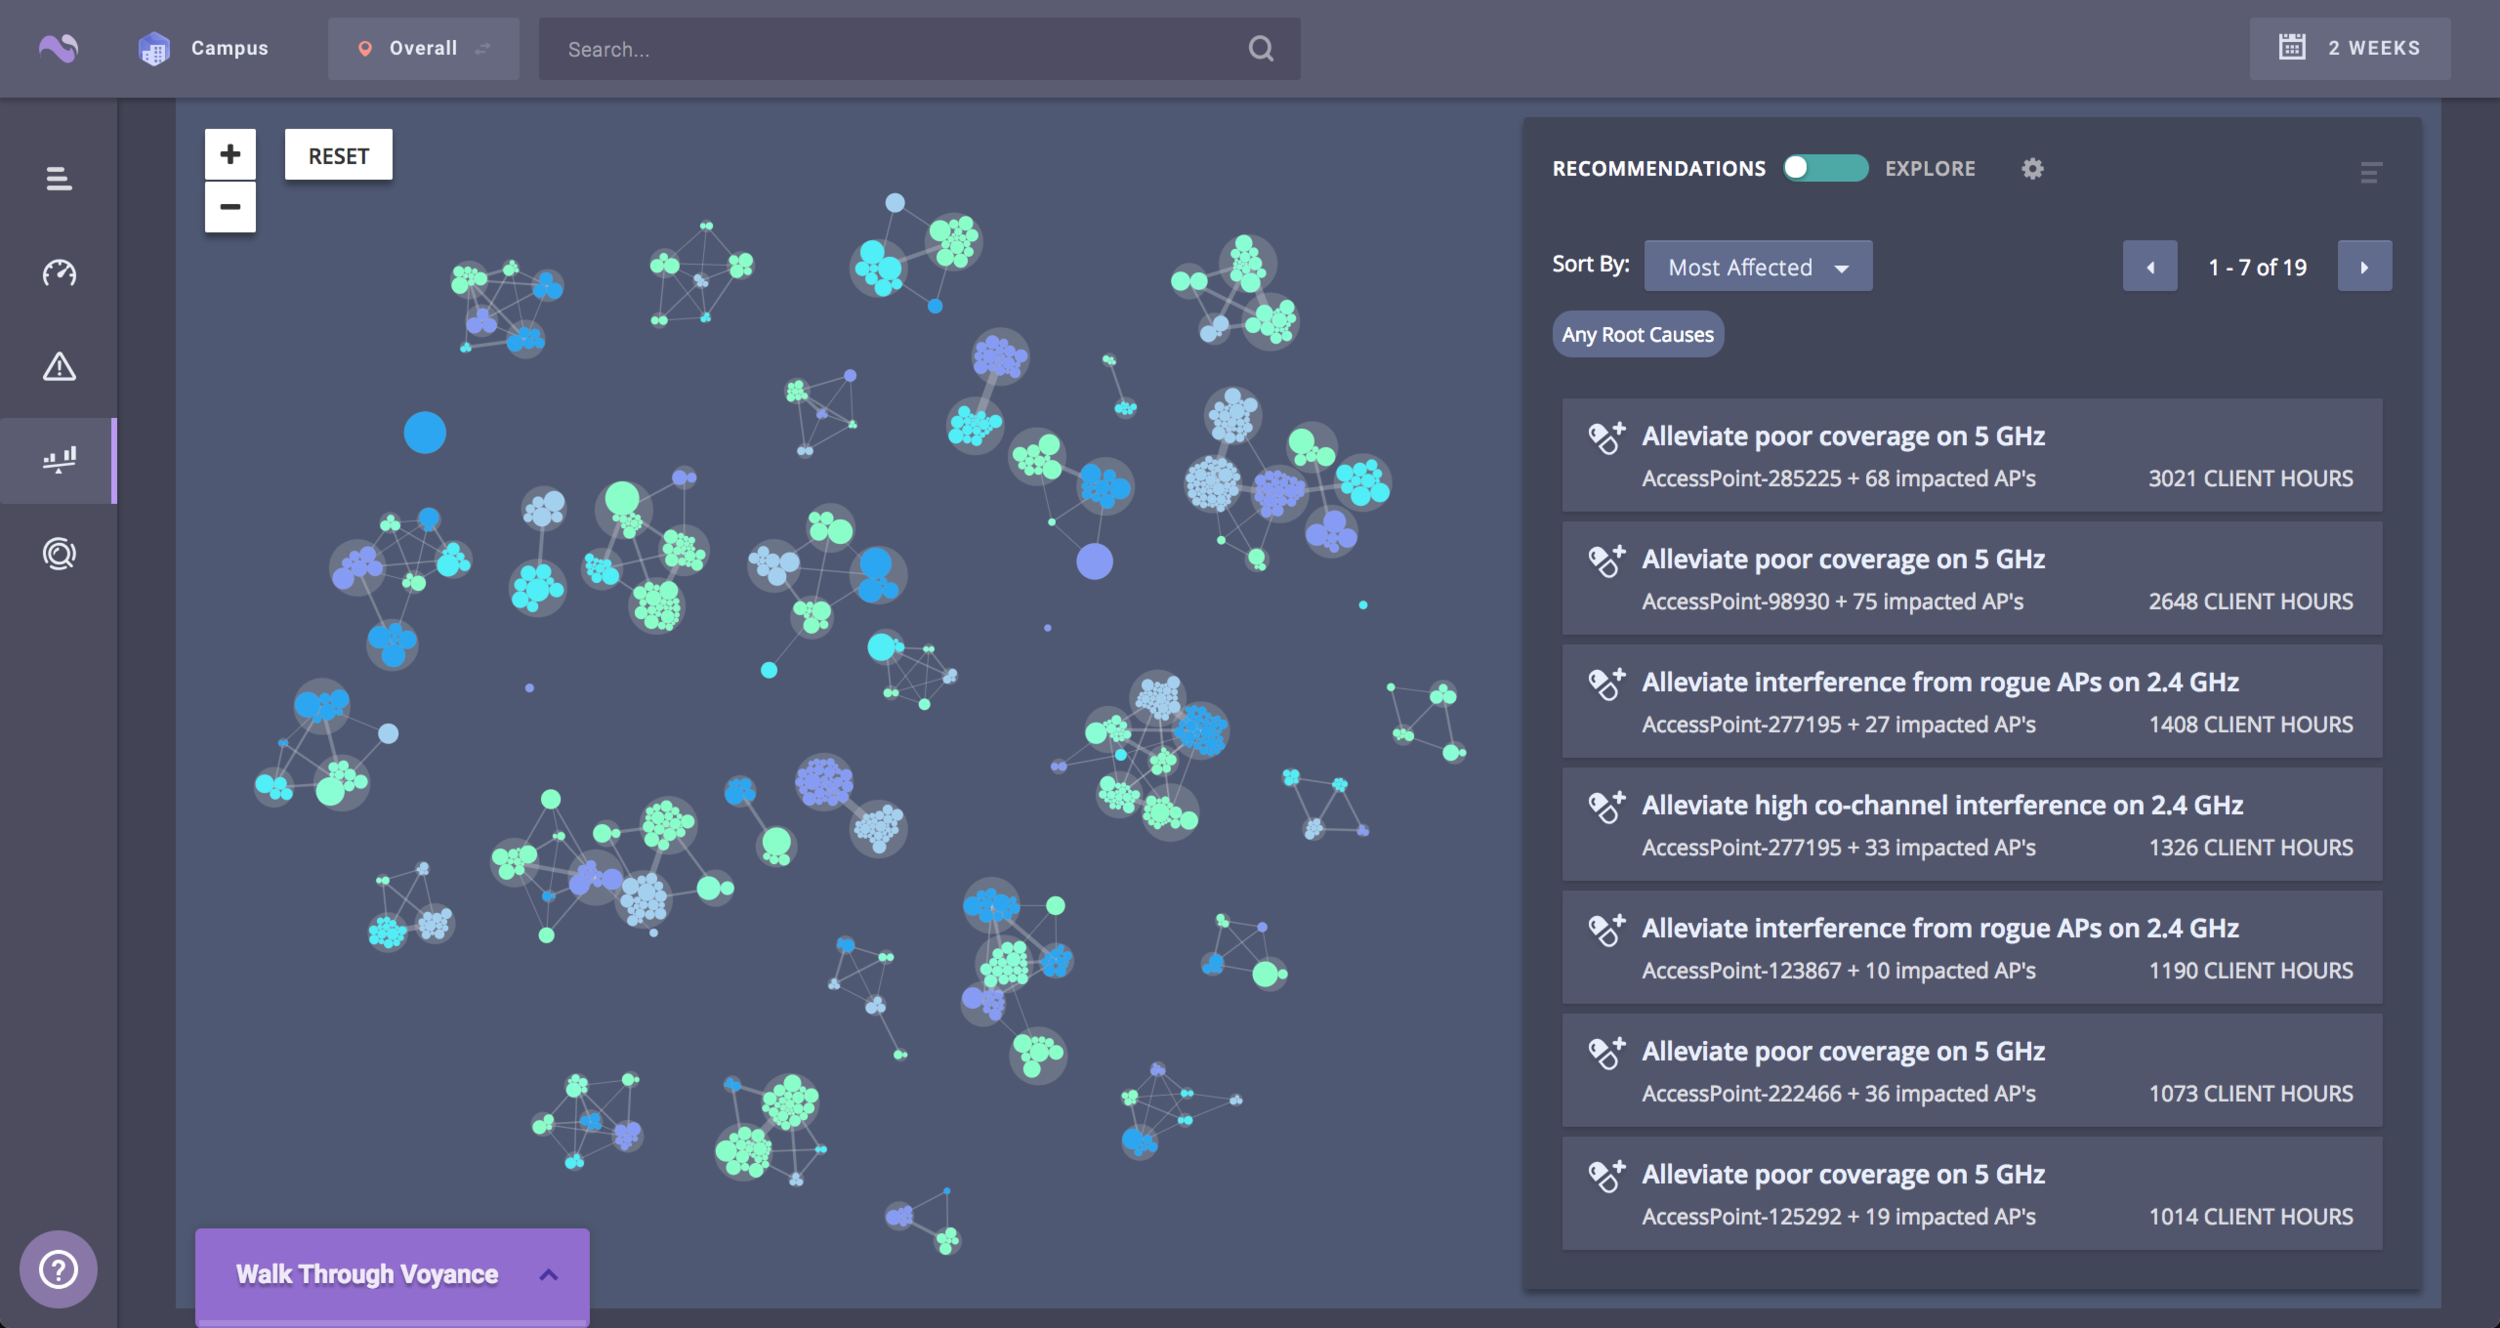
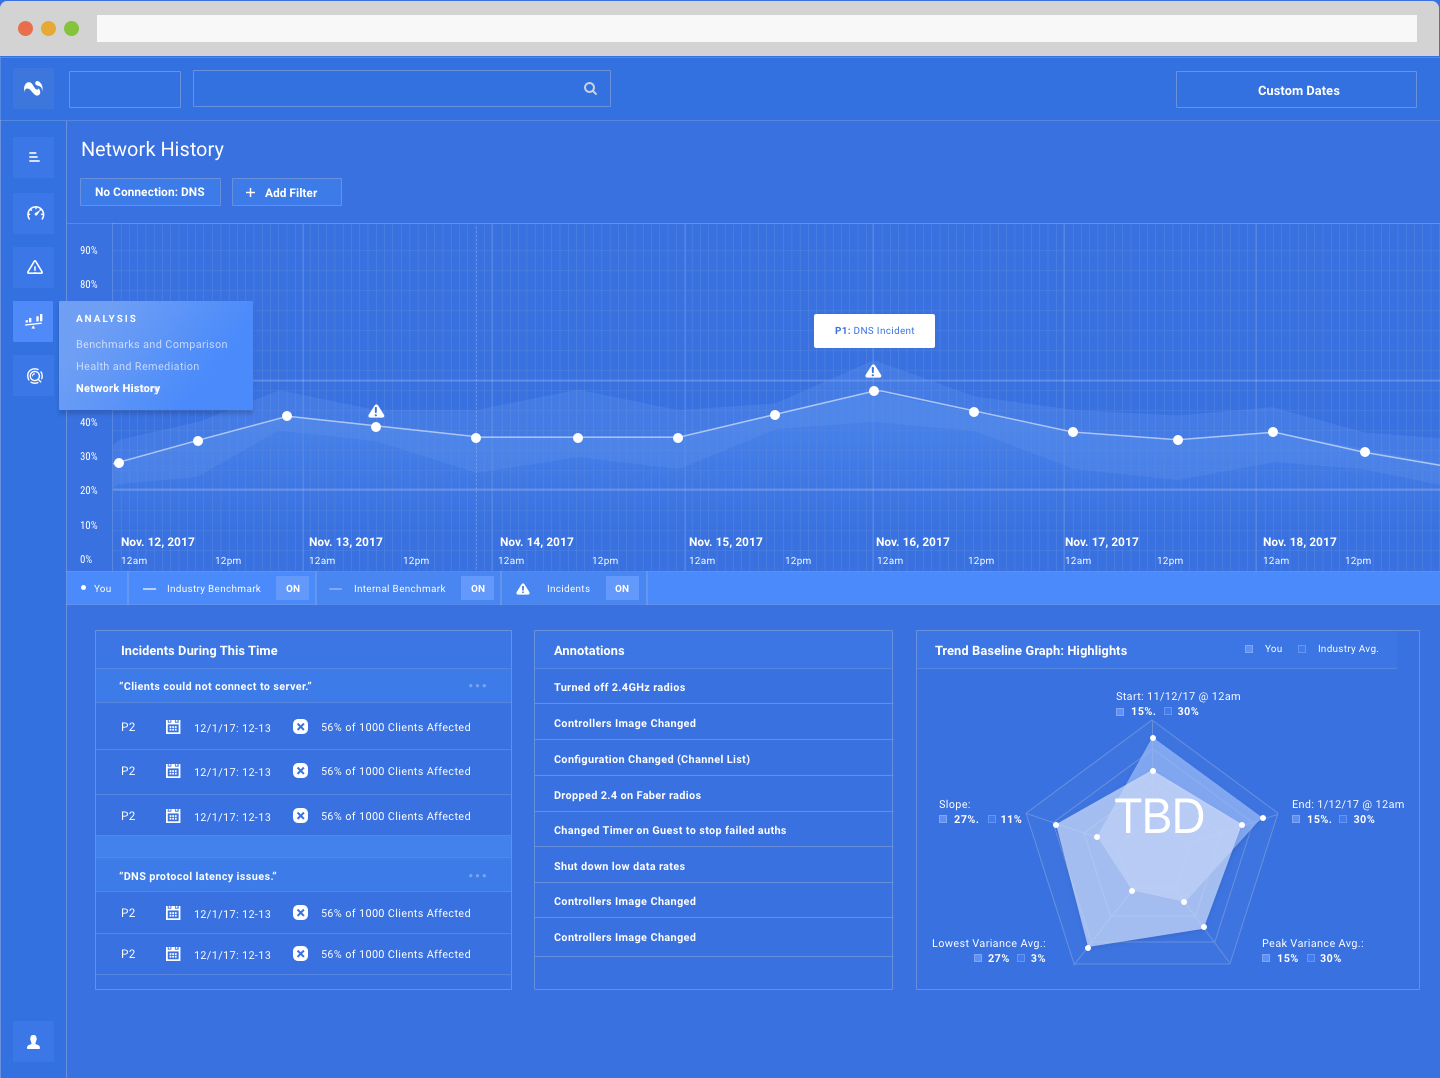
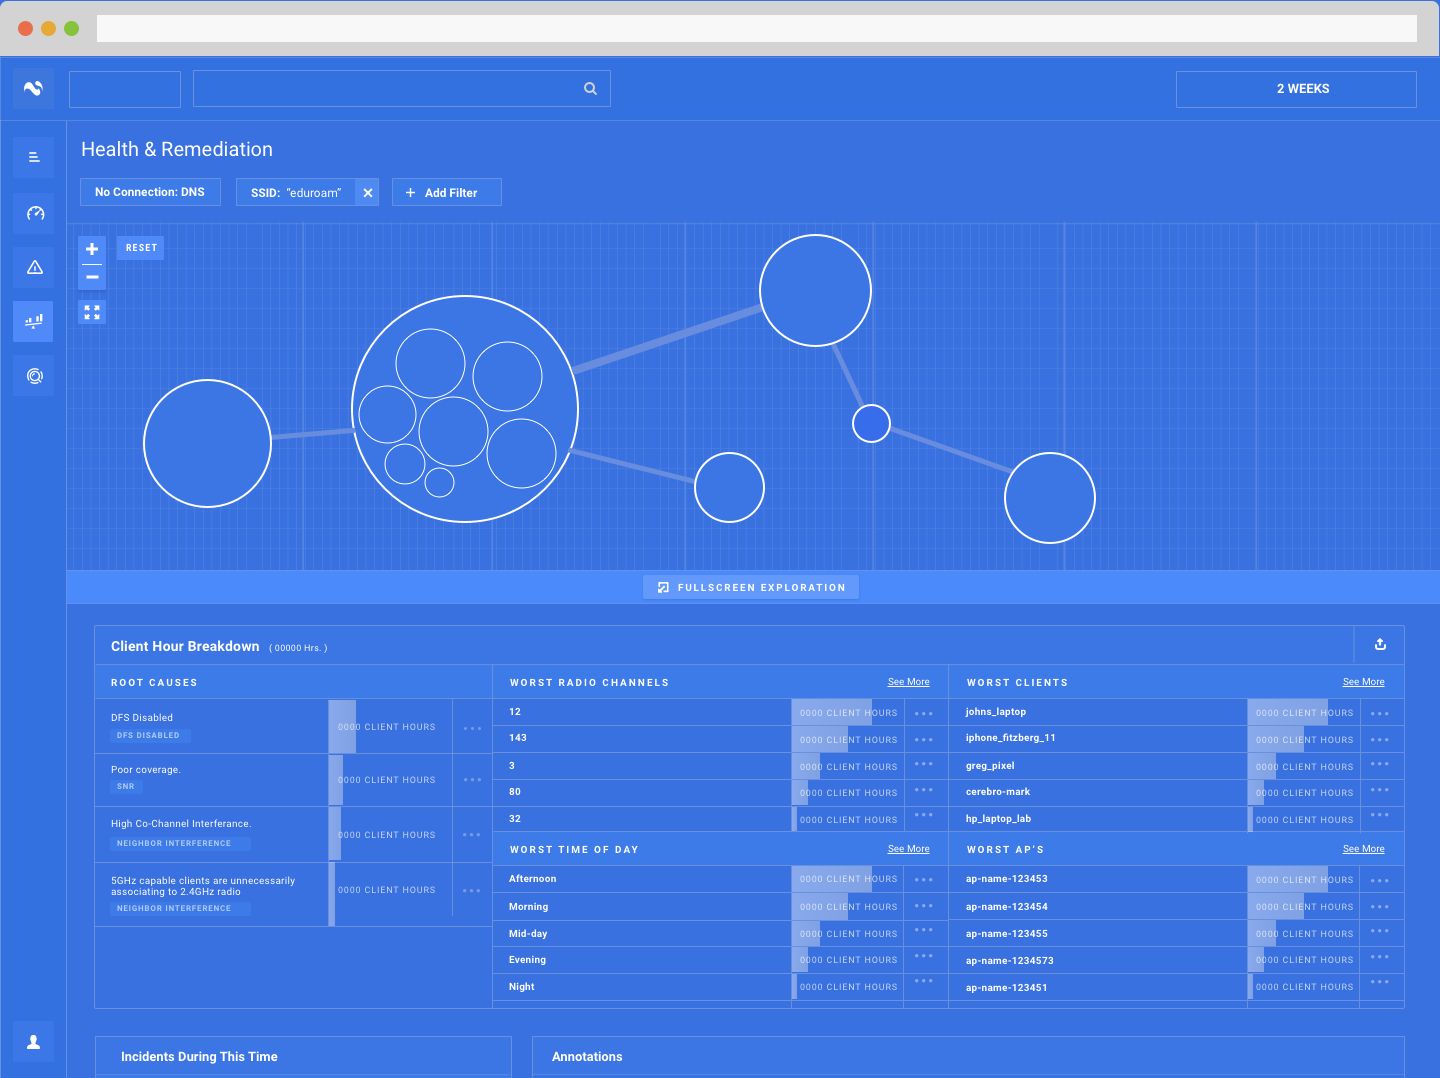
HEALTH AND REMEDIATION:
Thesis: I want slice and dice my own date to discover things I would not have otherwise known.
Need for full customization in product,
Workflow devoted to custom searches and cross analysis
Section could be used as free-for-all when it came to cross analysis
Focus on aid in remediating issues
Analyzing network’s health and discover start points
INTERFACE:
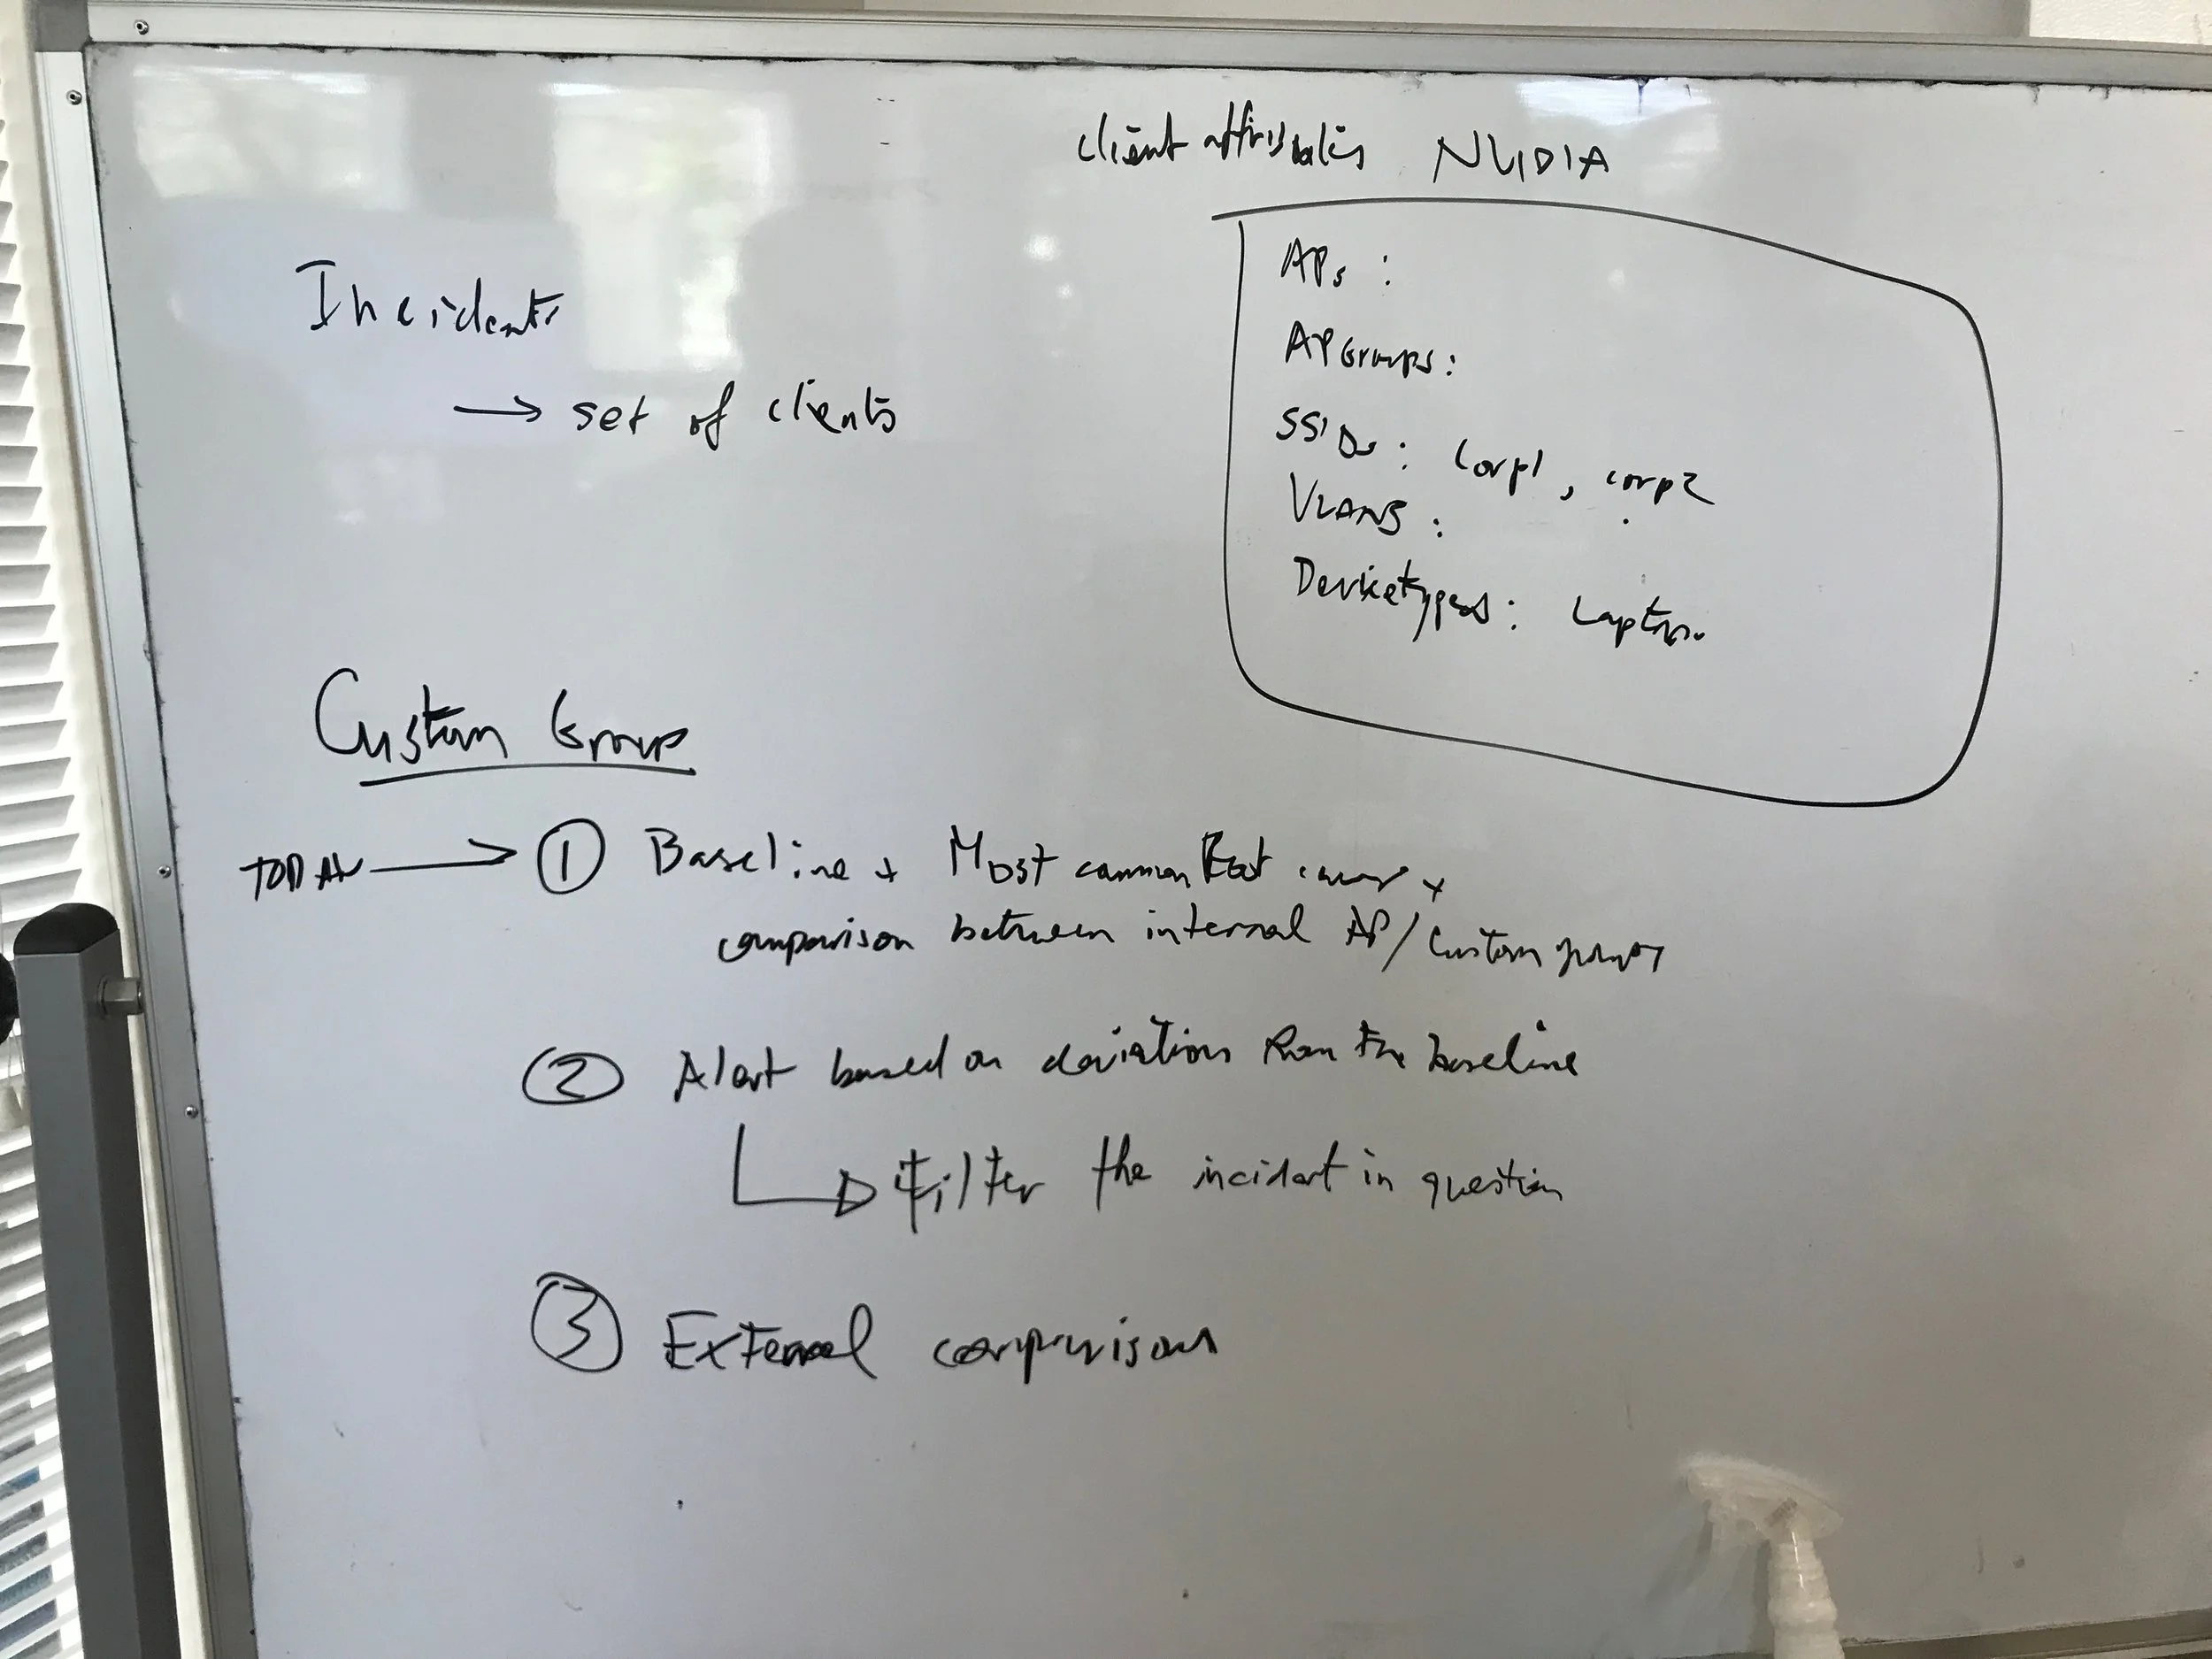
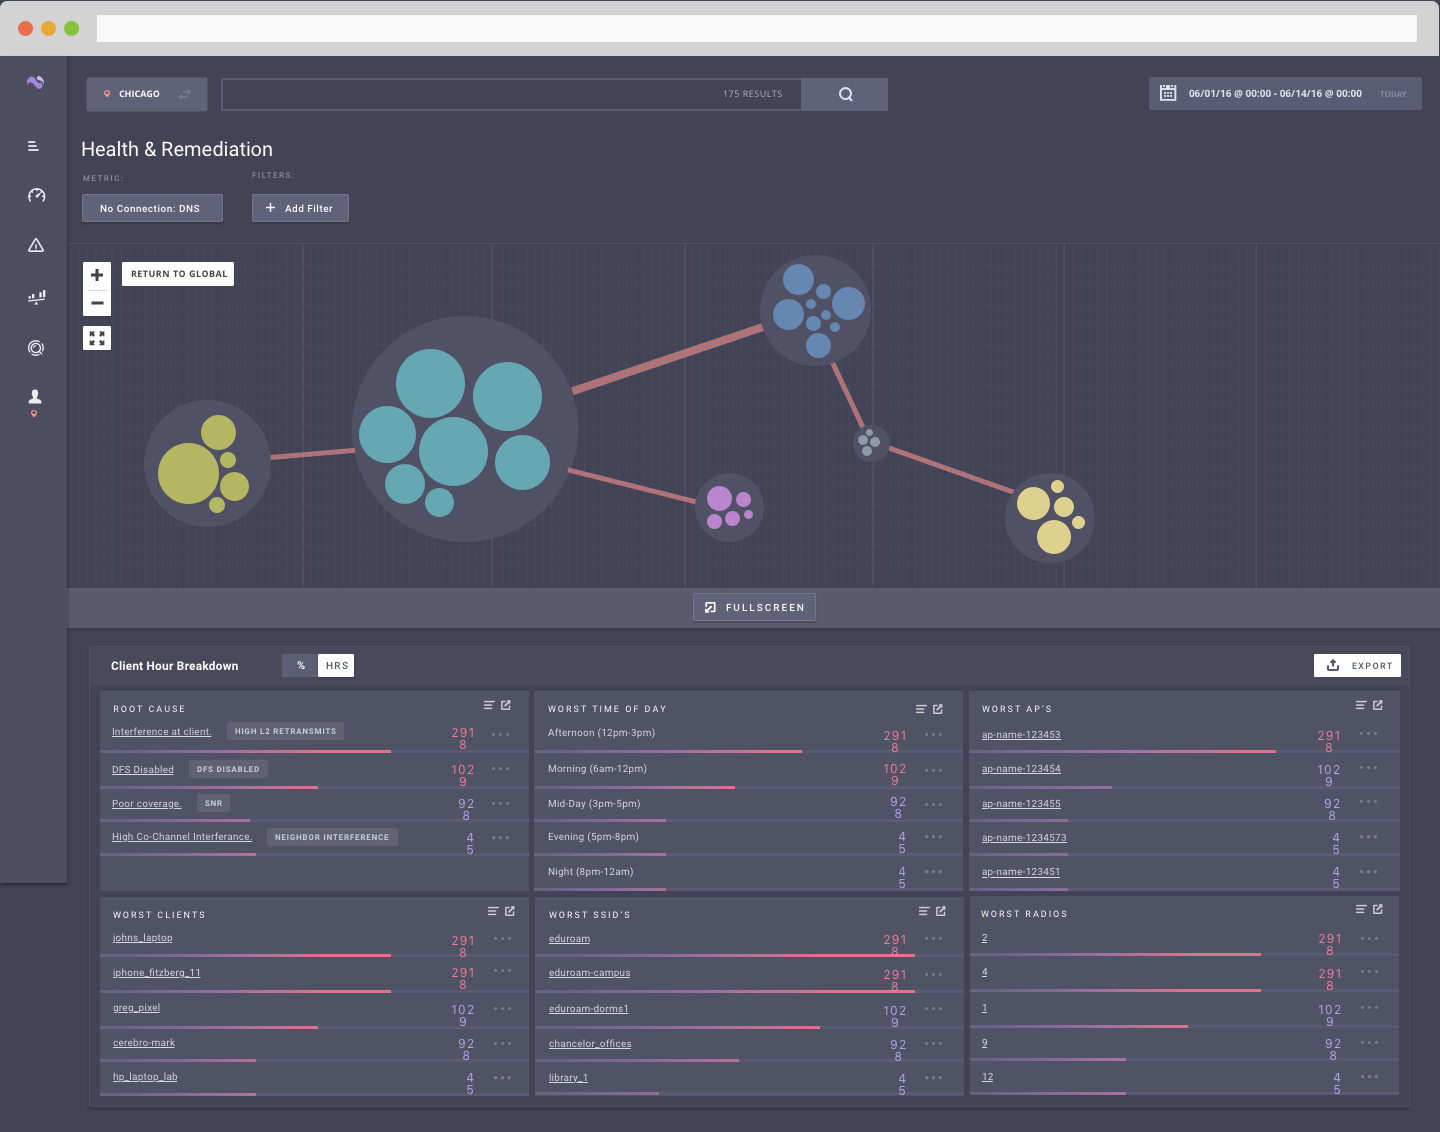
After reorganizing the information architecture, we began to focus on page layout and data visualization. A strong focus was put on simplicity: simple charts, simple lists, simple metrics.
After some basic sketching and white boarding, I wireframed the key pages along with some critical extensions where necessary. With literal blueprints in hand, we went through our rounds of iterative feedback and design.

Speaking to stakeholders, from data science to sales, we iterated. Our focus was on retaining the things that worked (baseline comparisons, incident correlations, and comparative benchmarks) while adding things that were missed (dedicated health pages, global industry comparisons, custom filtering across all metrics).
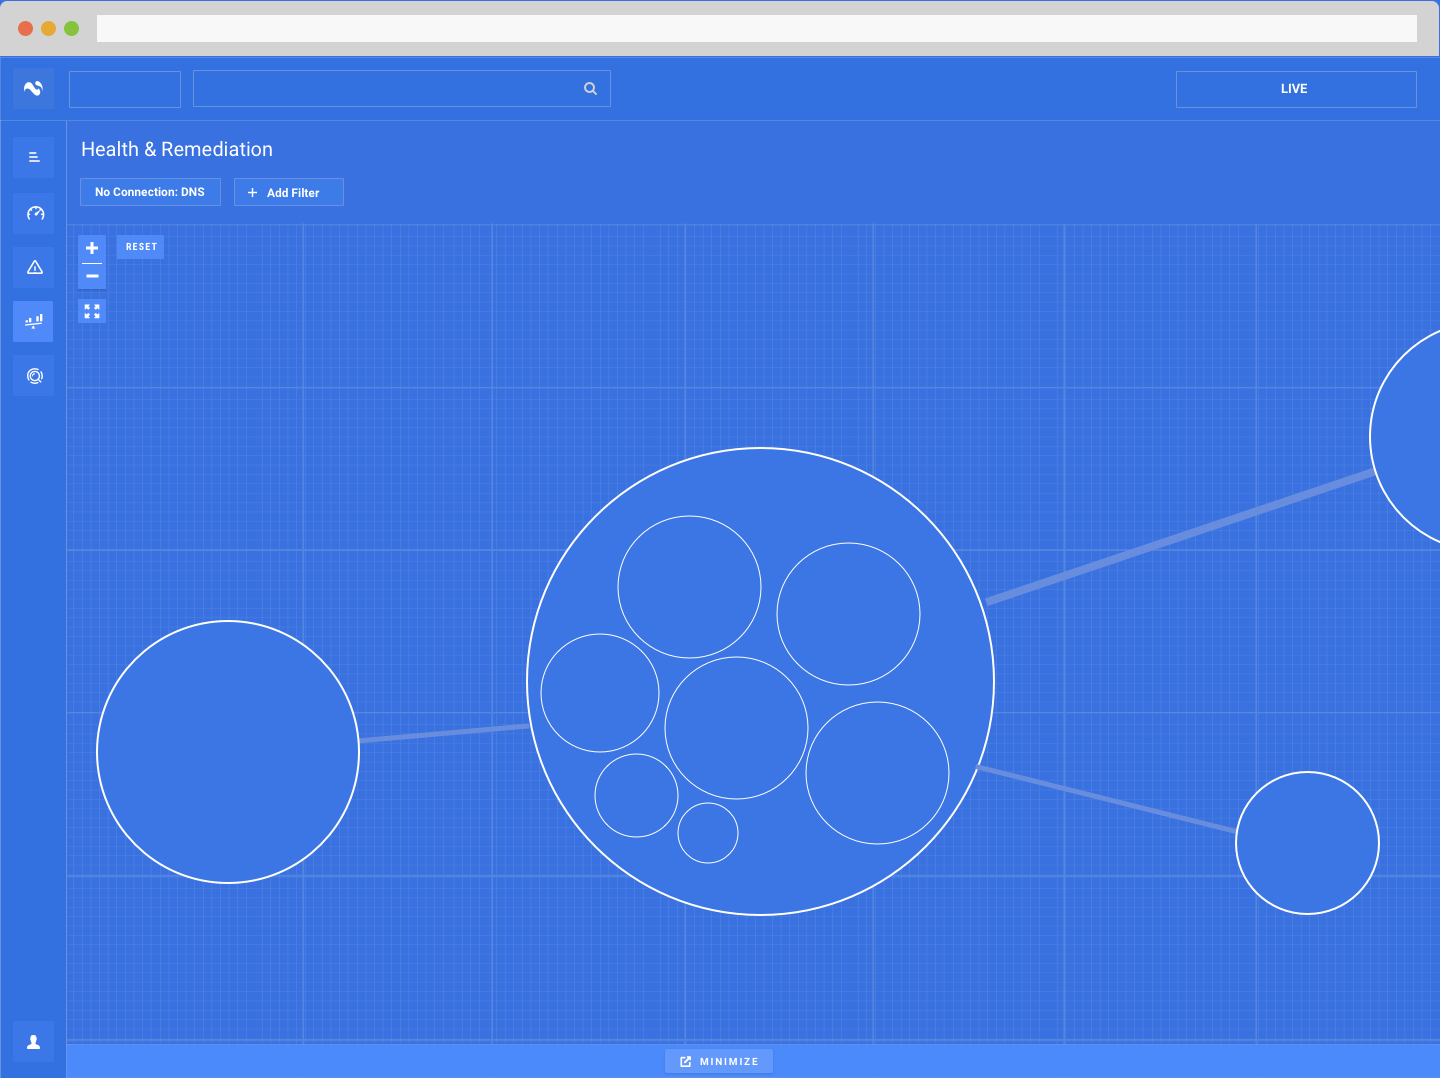
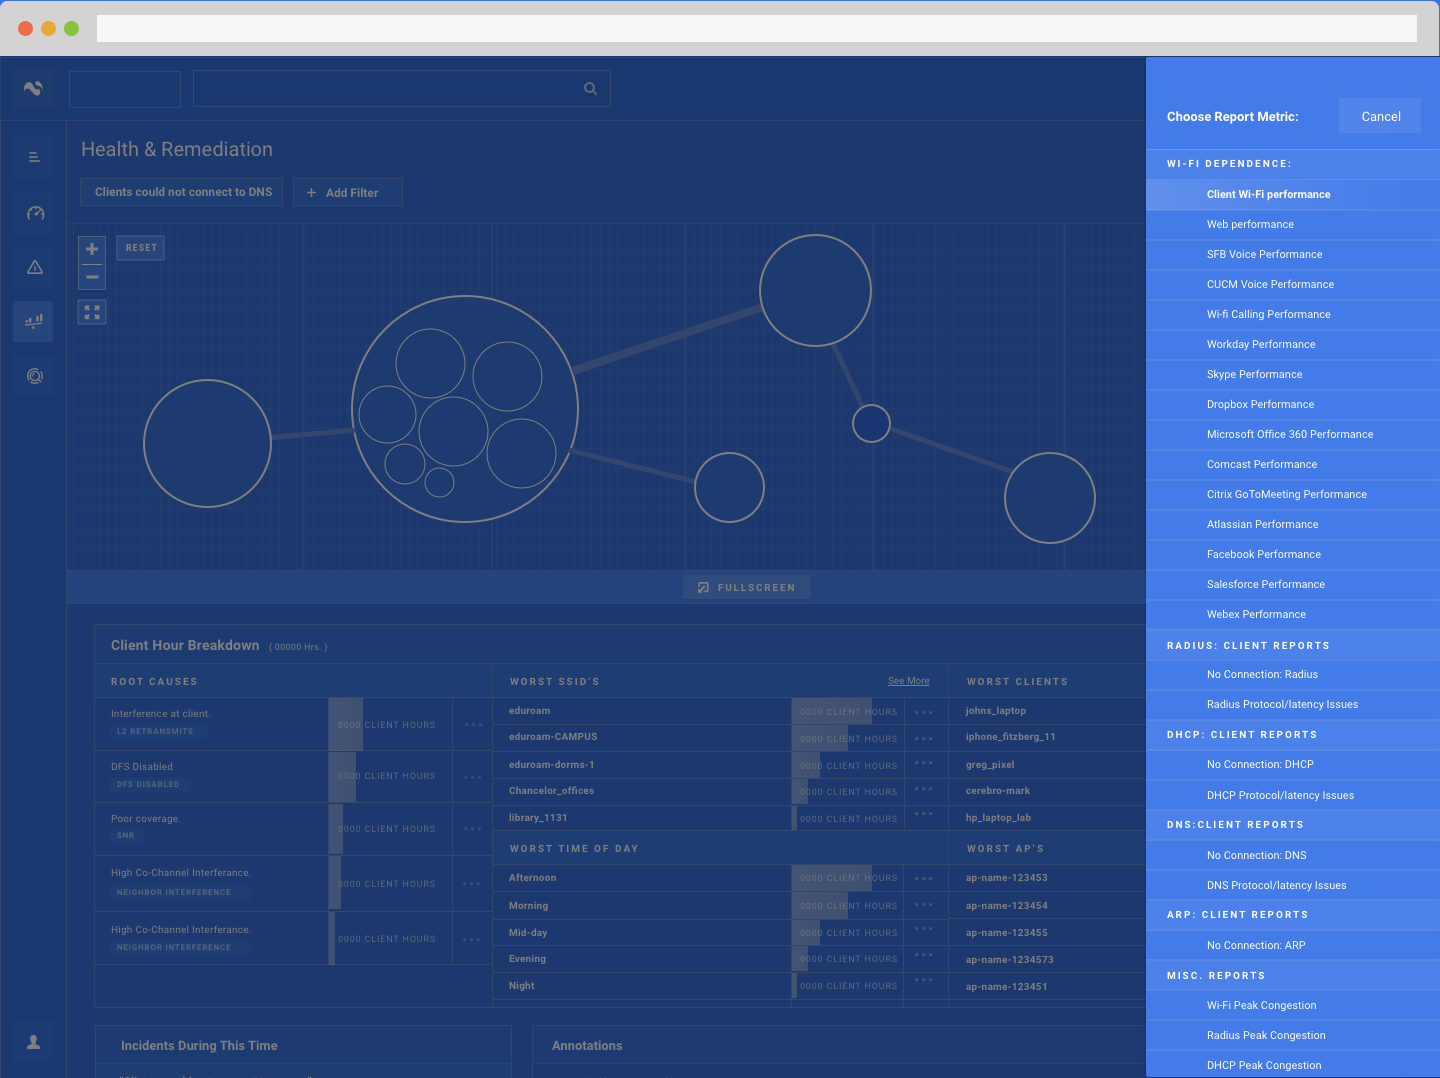
ACCESSIBILITY AND DATA SURFACING
Since our app is web first, this was still the case when designing "Analysis".
In our first pass, our main focus was on workflow follow-through above all else. We wanted to ensure users would not come to this section just to be left with another dead end. In short, we wanted to open doors on each page to further analysis, either in the same section or within the details of a client, access point, server, etc.
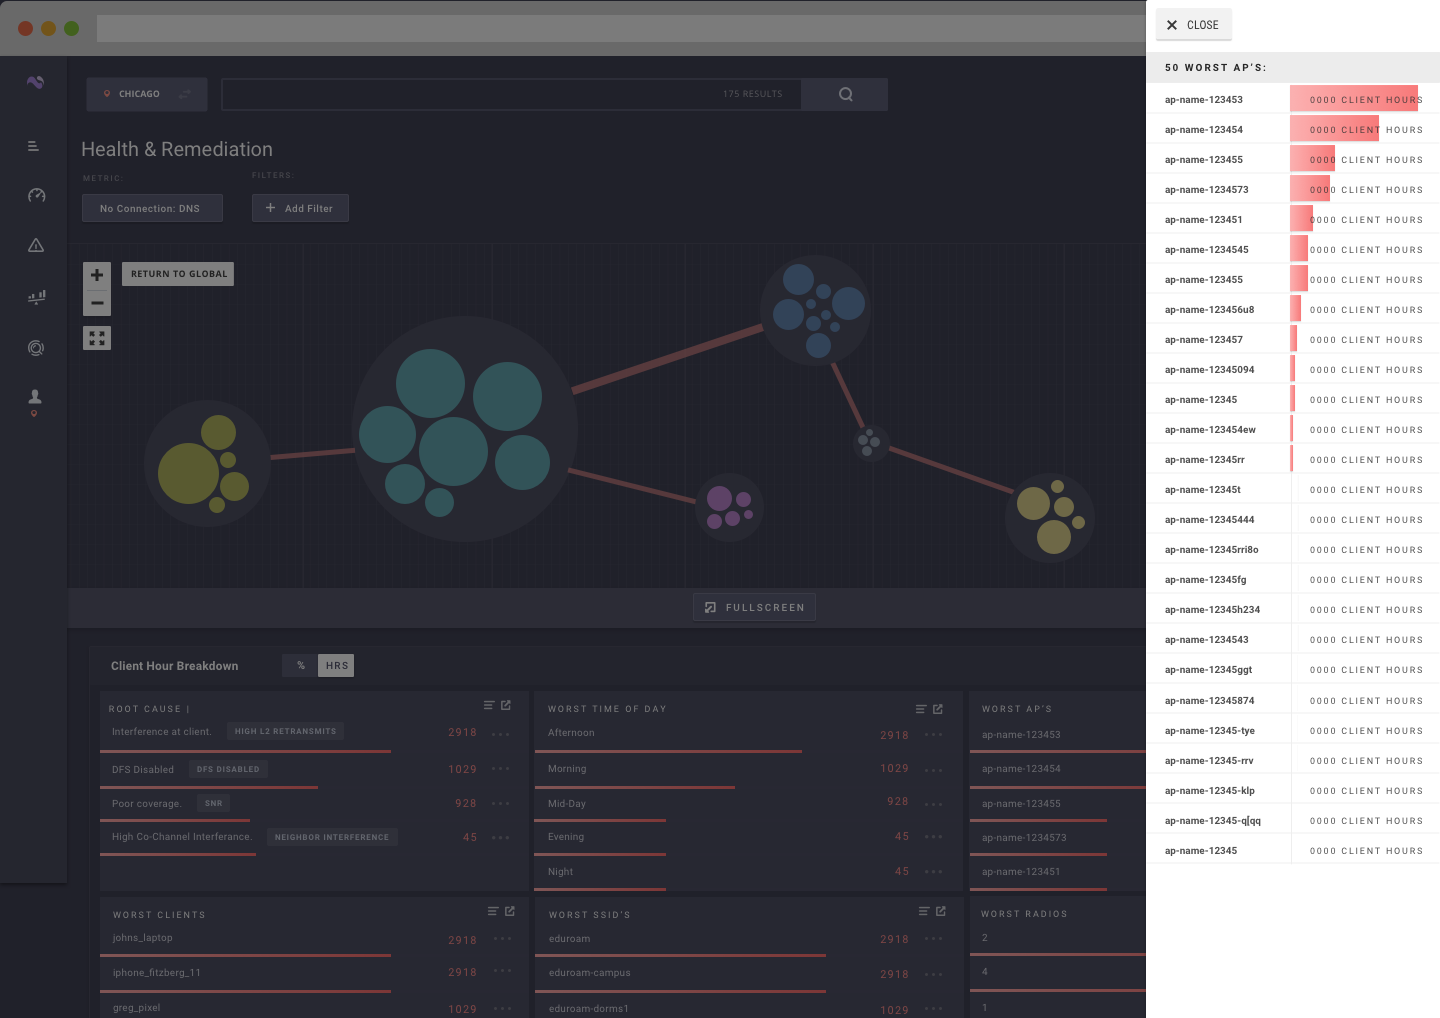
Our first pass at adding color opened up a whole new can of worms:
TESTING AND FEEDBACK GATHERING
We tested it out with our sales and customer success team prior to demoing it for customers.
This would have been good to know:
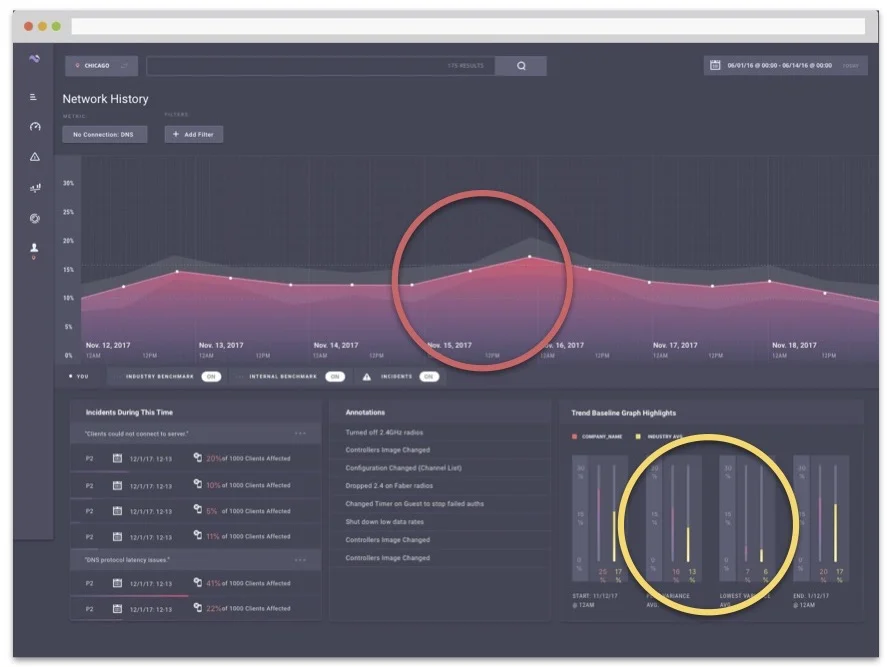
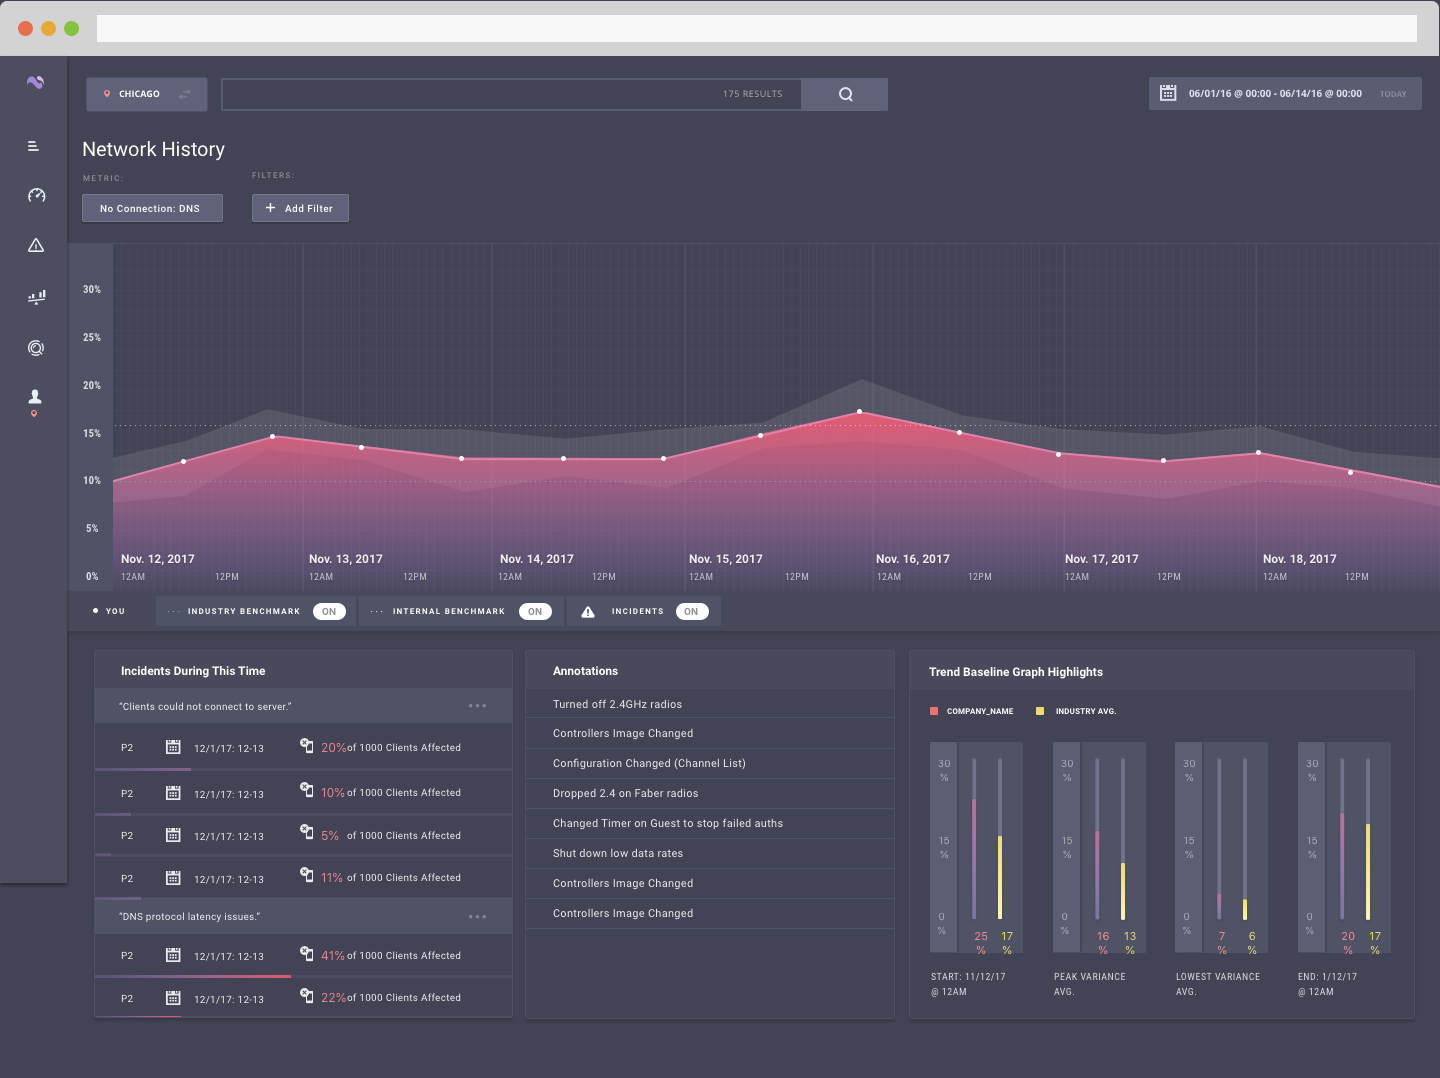
HISTORY:
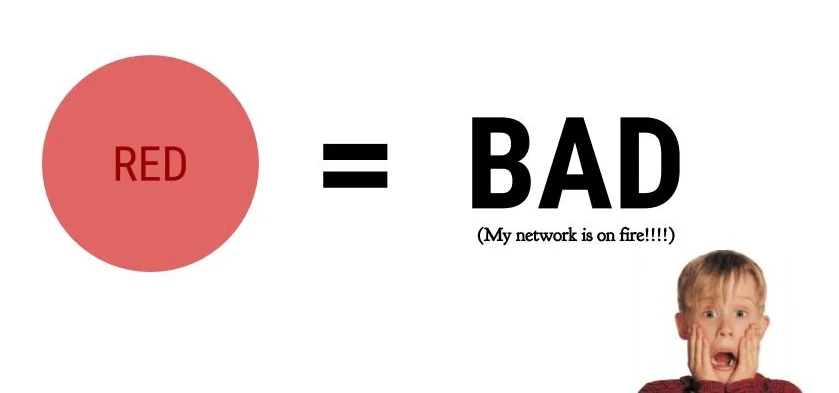
Pink, orange, yellow, red — those all mean the same thing: "My network is on fire."
The third visualization in History didn’t make sense
Organizing by incident rather than time didn’t fit the workflow of remediating issues. You start with time of incident and work backwards.
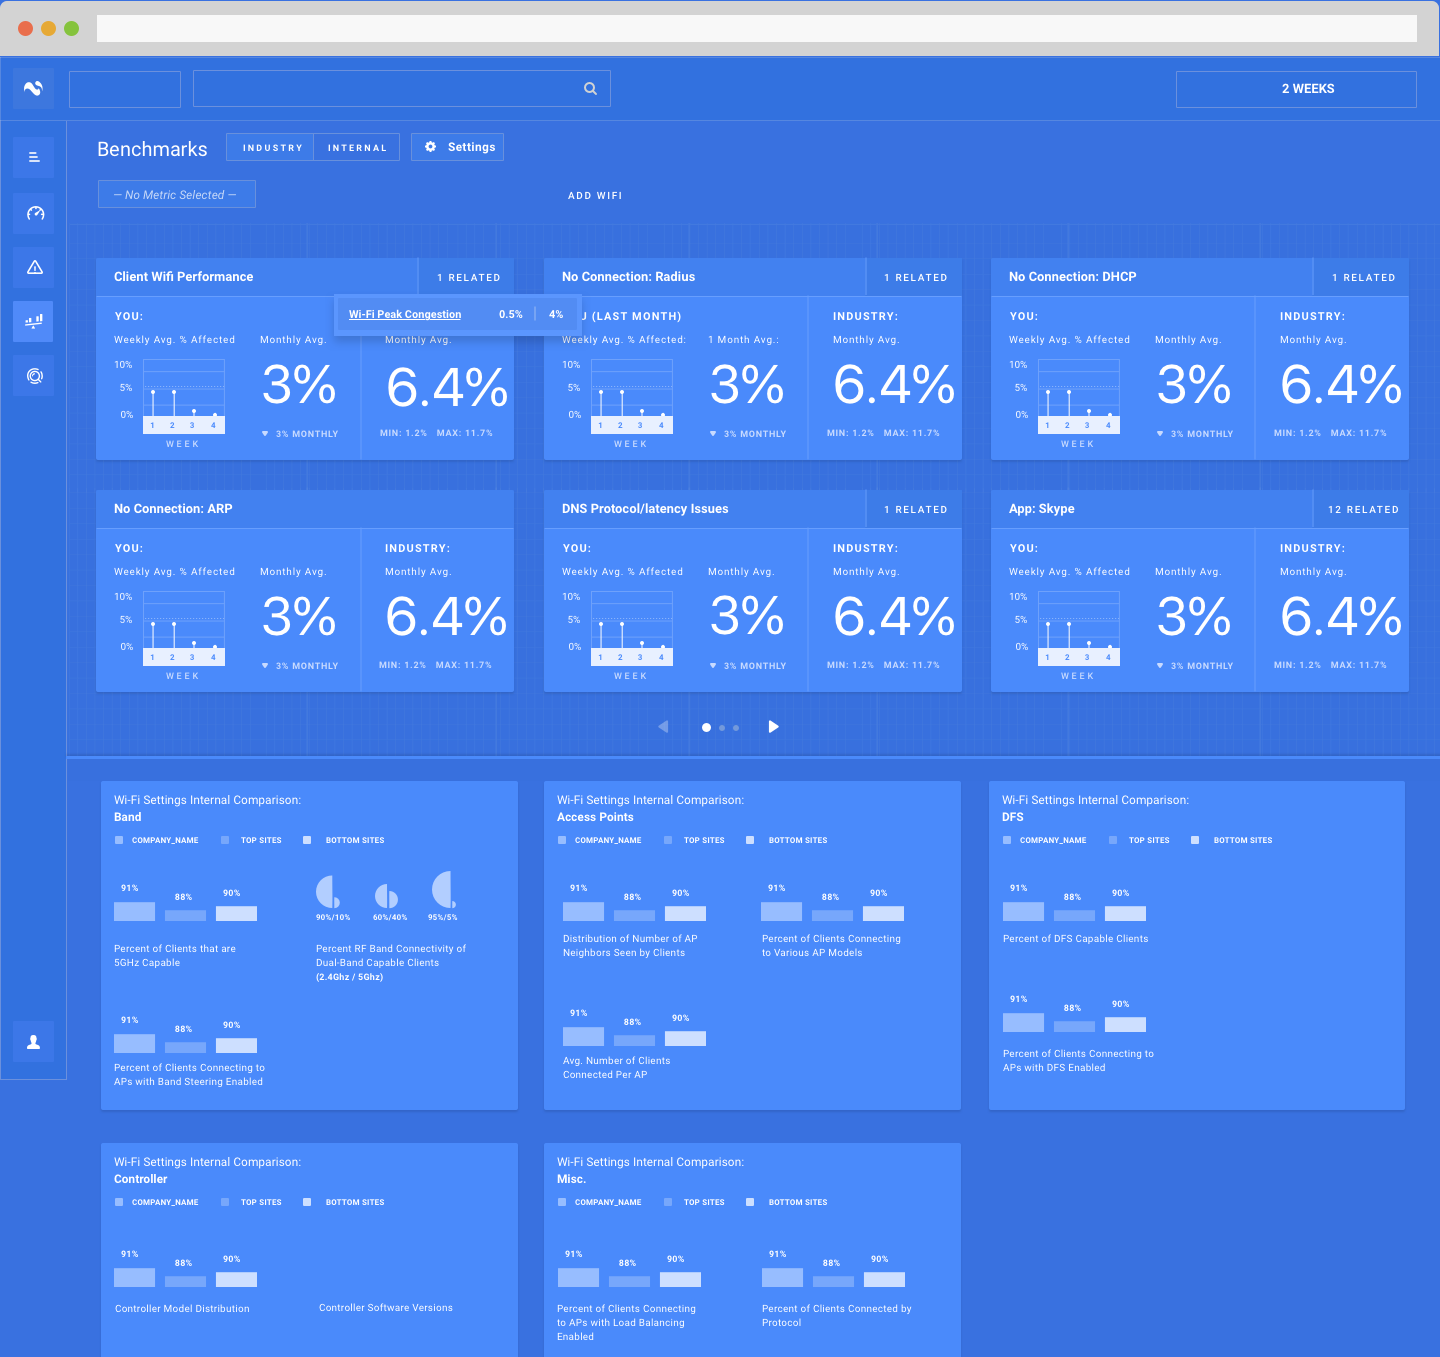
BENCHMARKS:
Wi-fi data was too ambitious with how it was visualized
Sparkline charts distracted them from their task and details for them were lost
Benchmark details was "scary"; the red and yellow was distracting and misleading. “My network is on fire.”
HEALTH AND REMEDIATION:
The AP relational map was unnecessary and over emphasized. (We now hide it by default)
Filtering was useful but with so much data, it needed to have the option for include and exclude of values
Did I mention: “My network is on fire.”
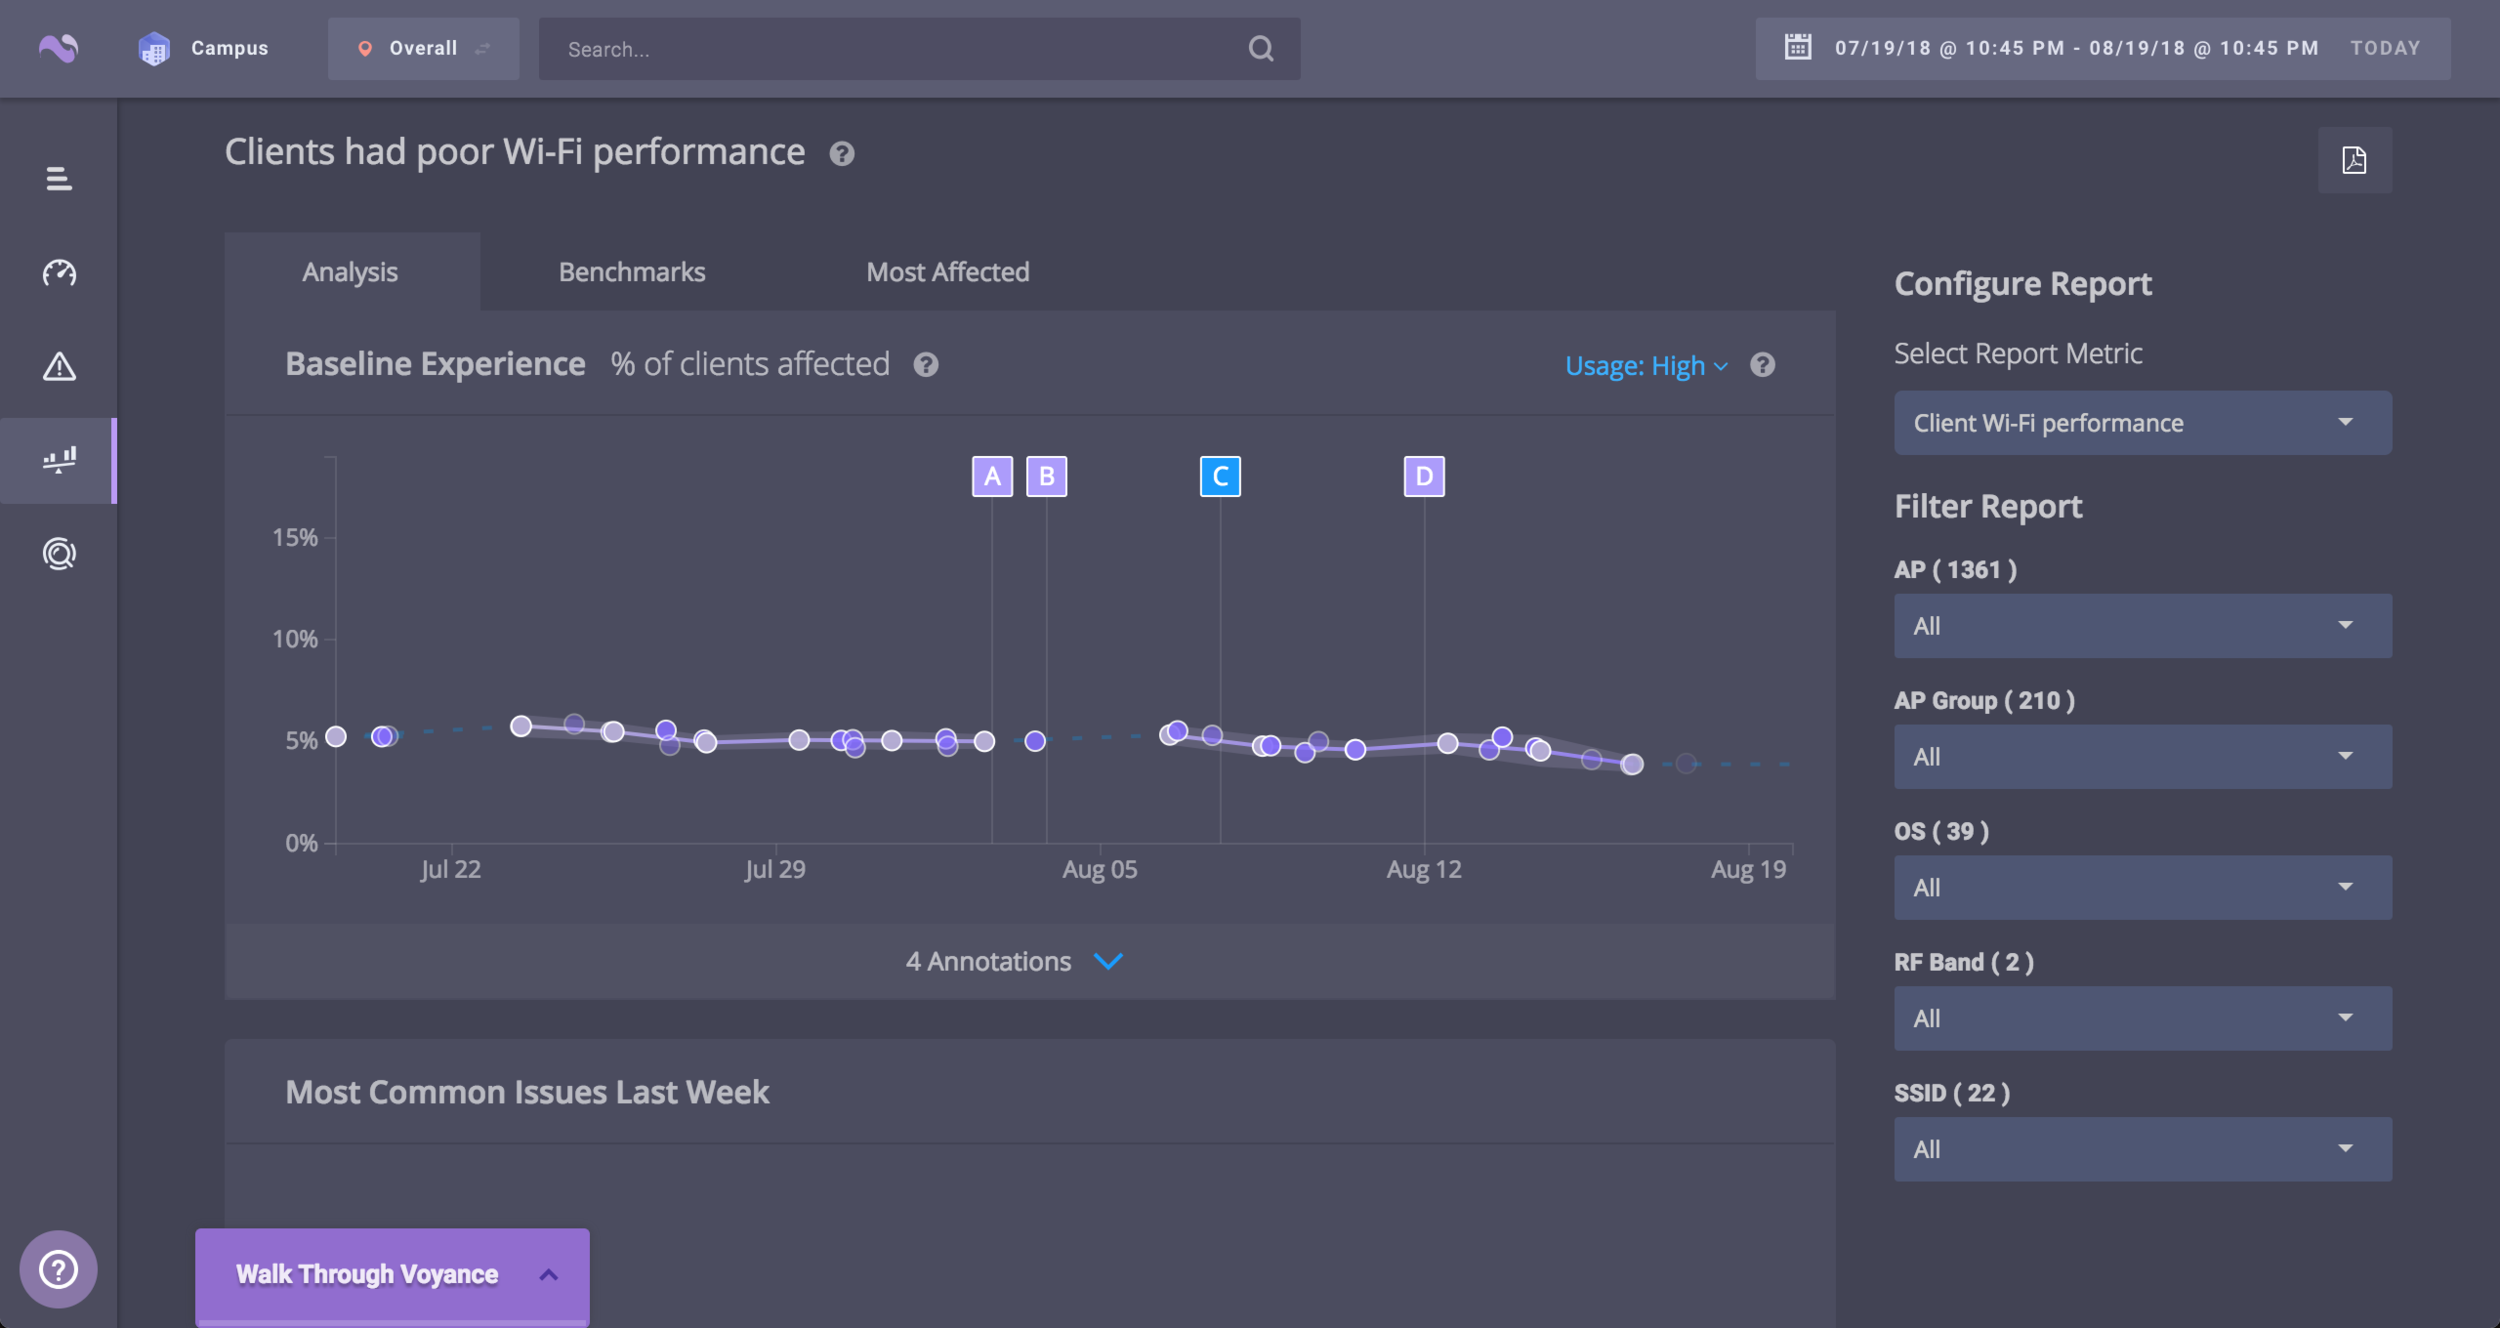
After feedback gathering, adjusting and reducing, we released a beta version of the new section to all of our customers.
Below is a short video showing the first version of our beta release.
RESULTS:
During the process of releasing this product into the wild, we continued to get valuable chunks of feedback from customers and customer success alike. We continued to learn more about how our data was being used, but as a whole, customers reacted positively to what they were seeing.
As is expected with a progressive design approach, we continued to refine and improve our analysis section, adding features like network friending and exclusion filtering.
Customers now find themselves frequenting that area to see more of their network's insights. We’ve seen a significant up-tick and interest in deep analysis and it’s been commonly referenced as one of the key value adds that Voyance brings when they are troubleshooting their network.
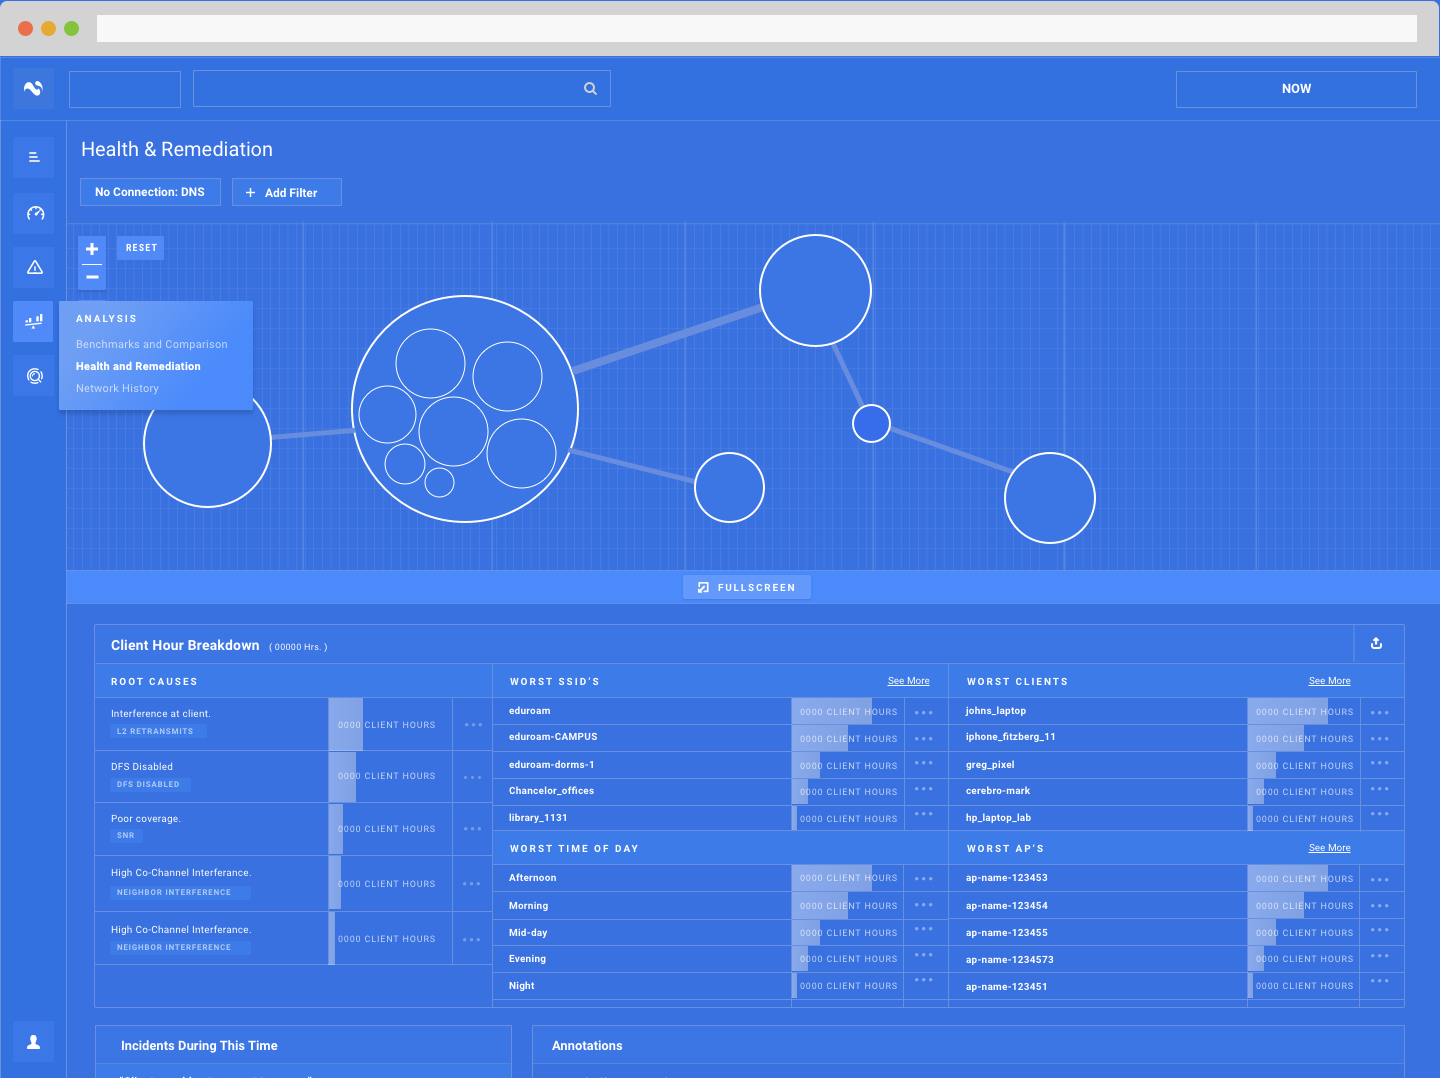
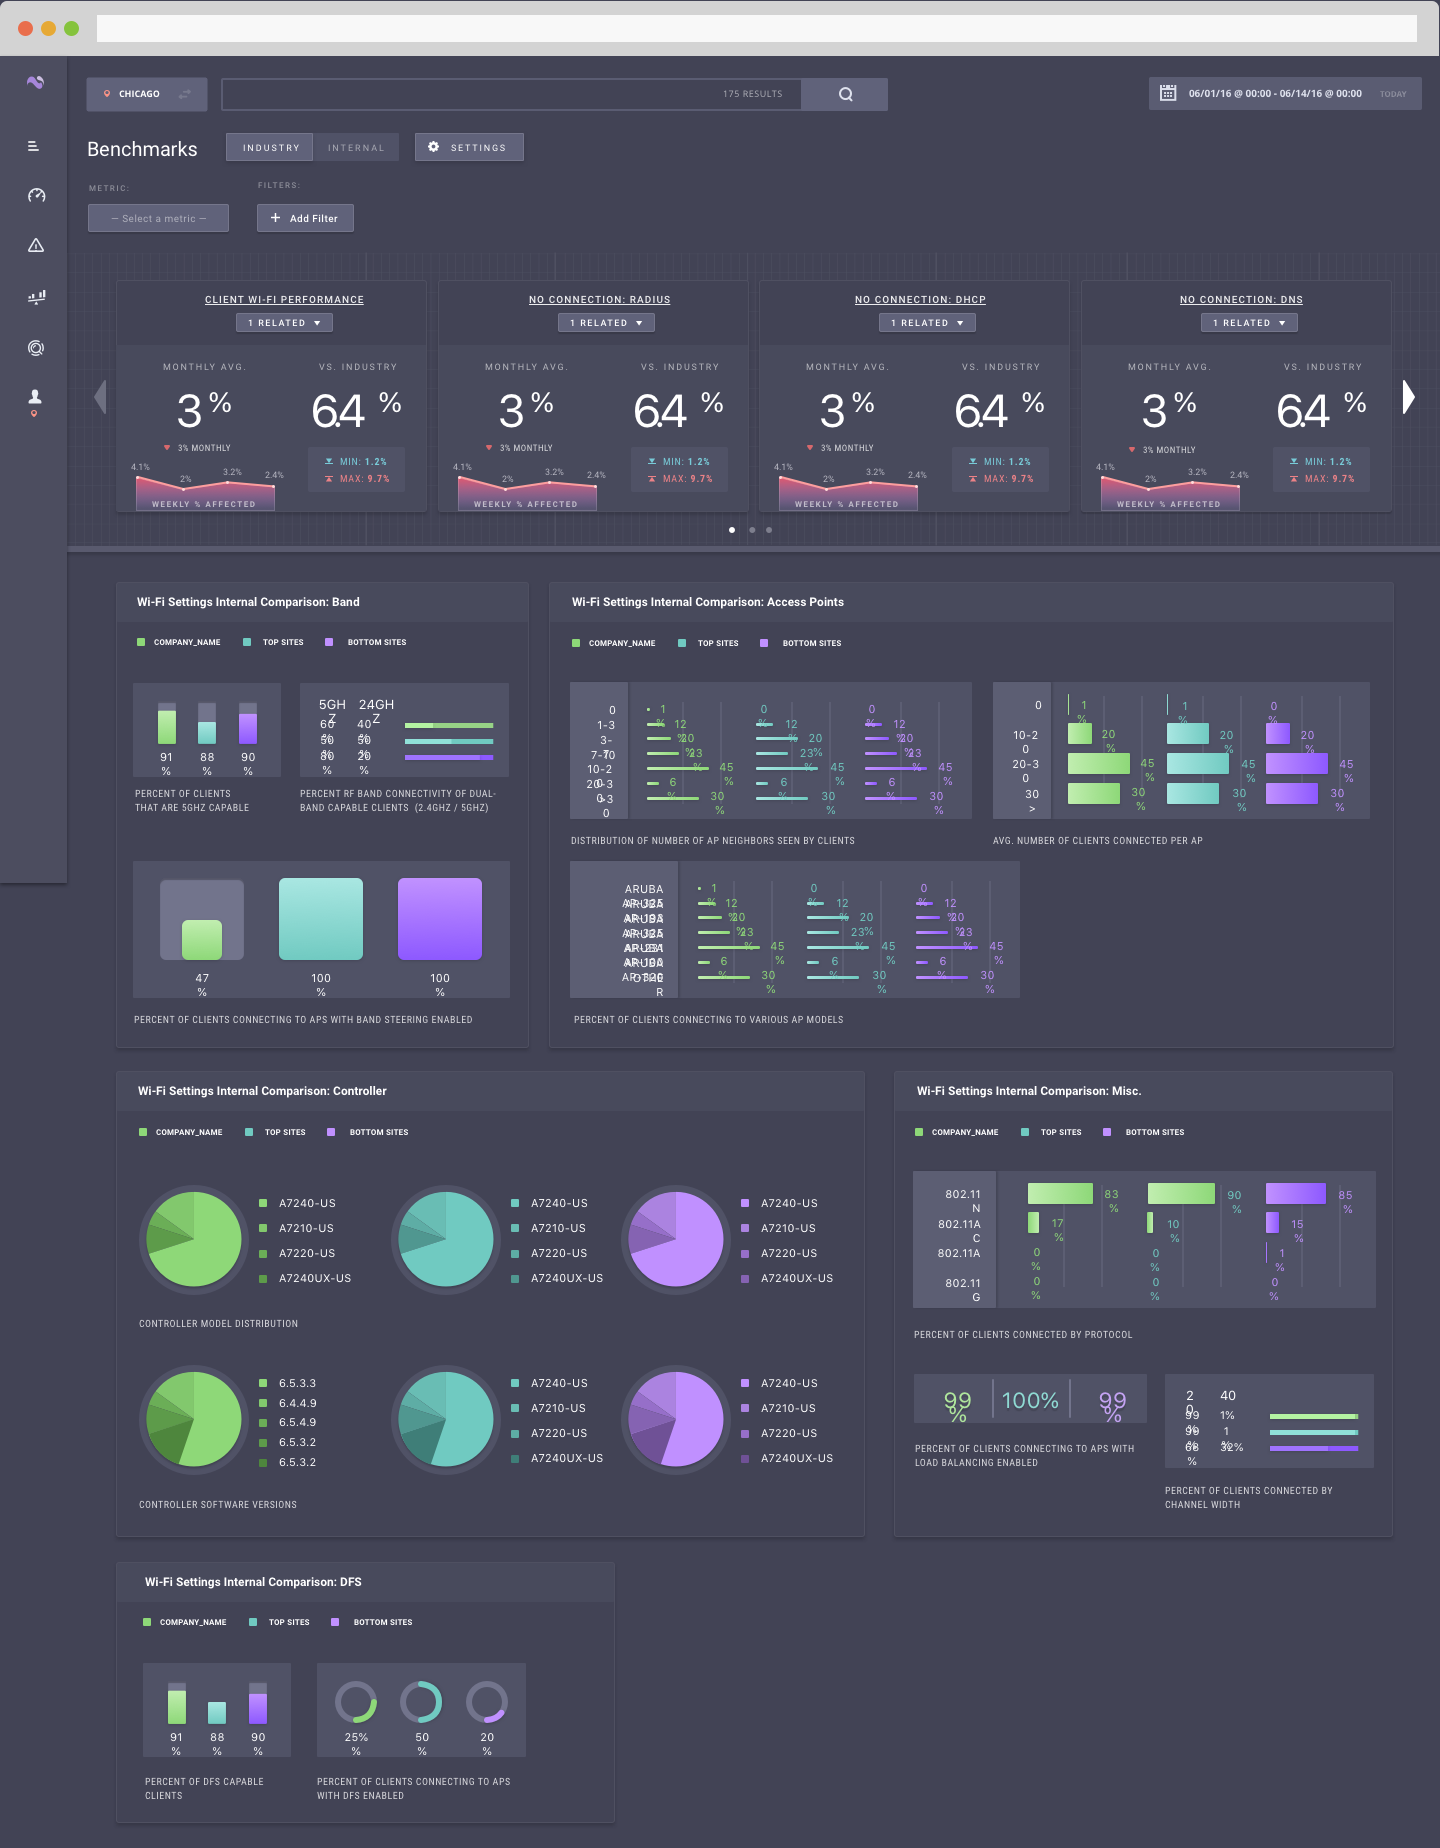
FINAL:
UNIFICATION AND FEATURE COMPLETE
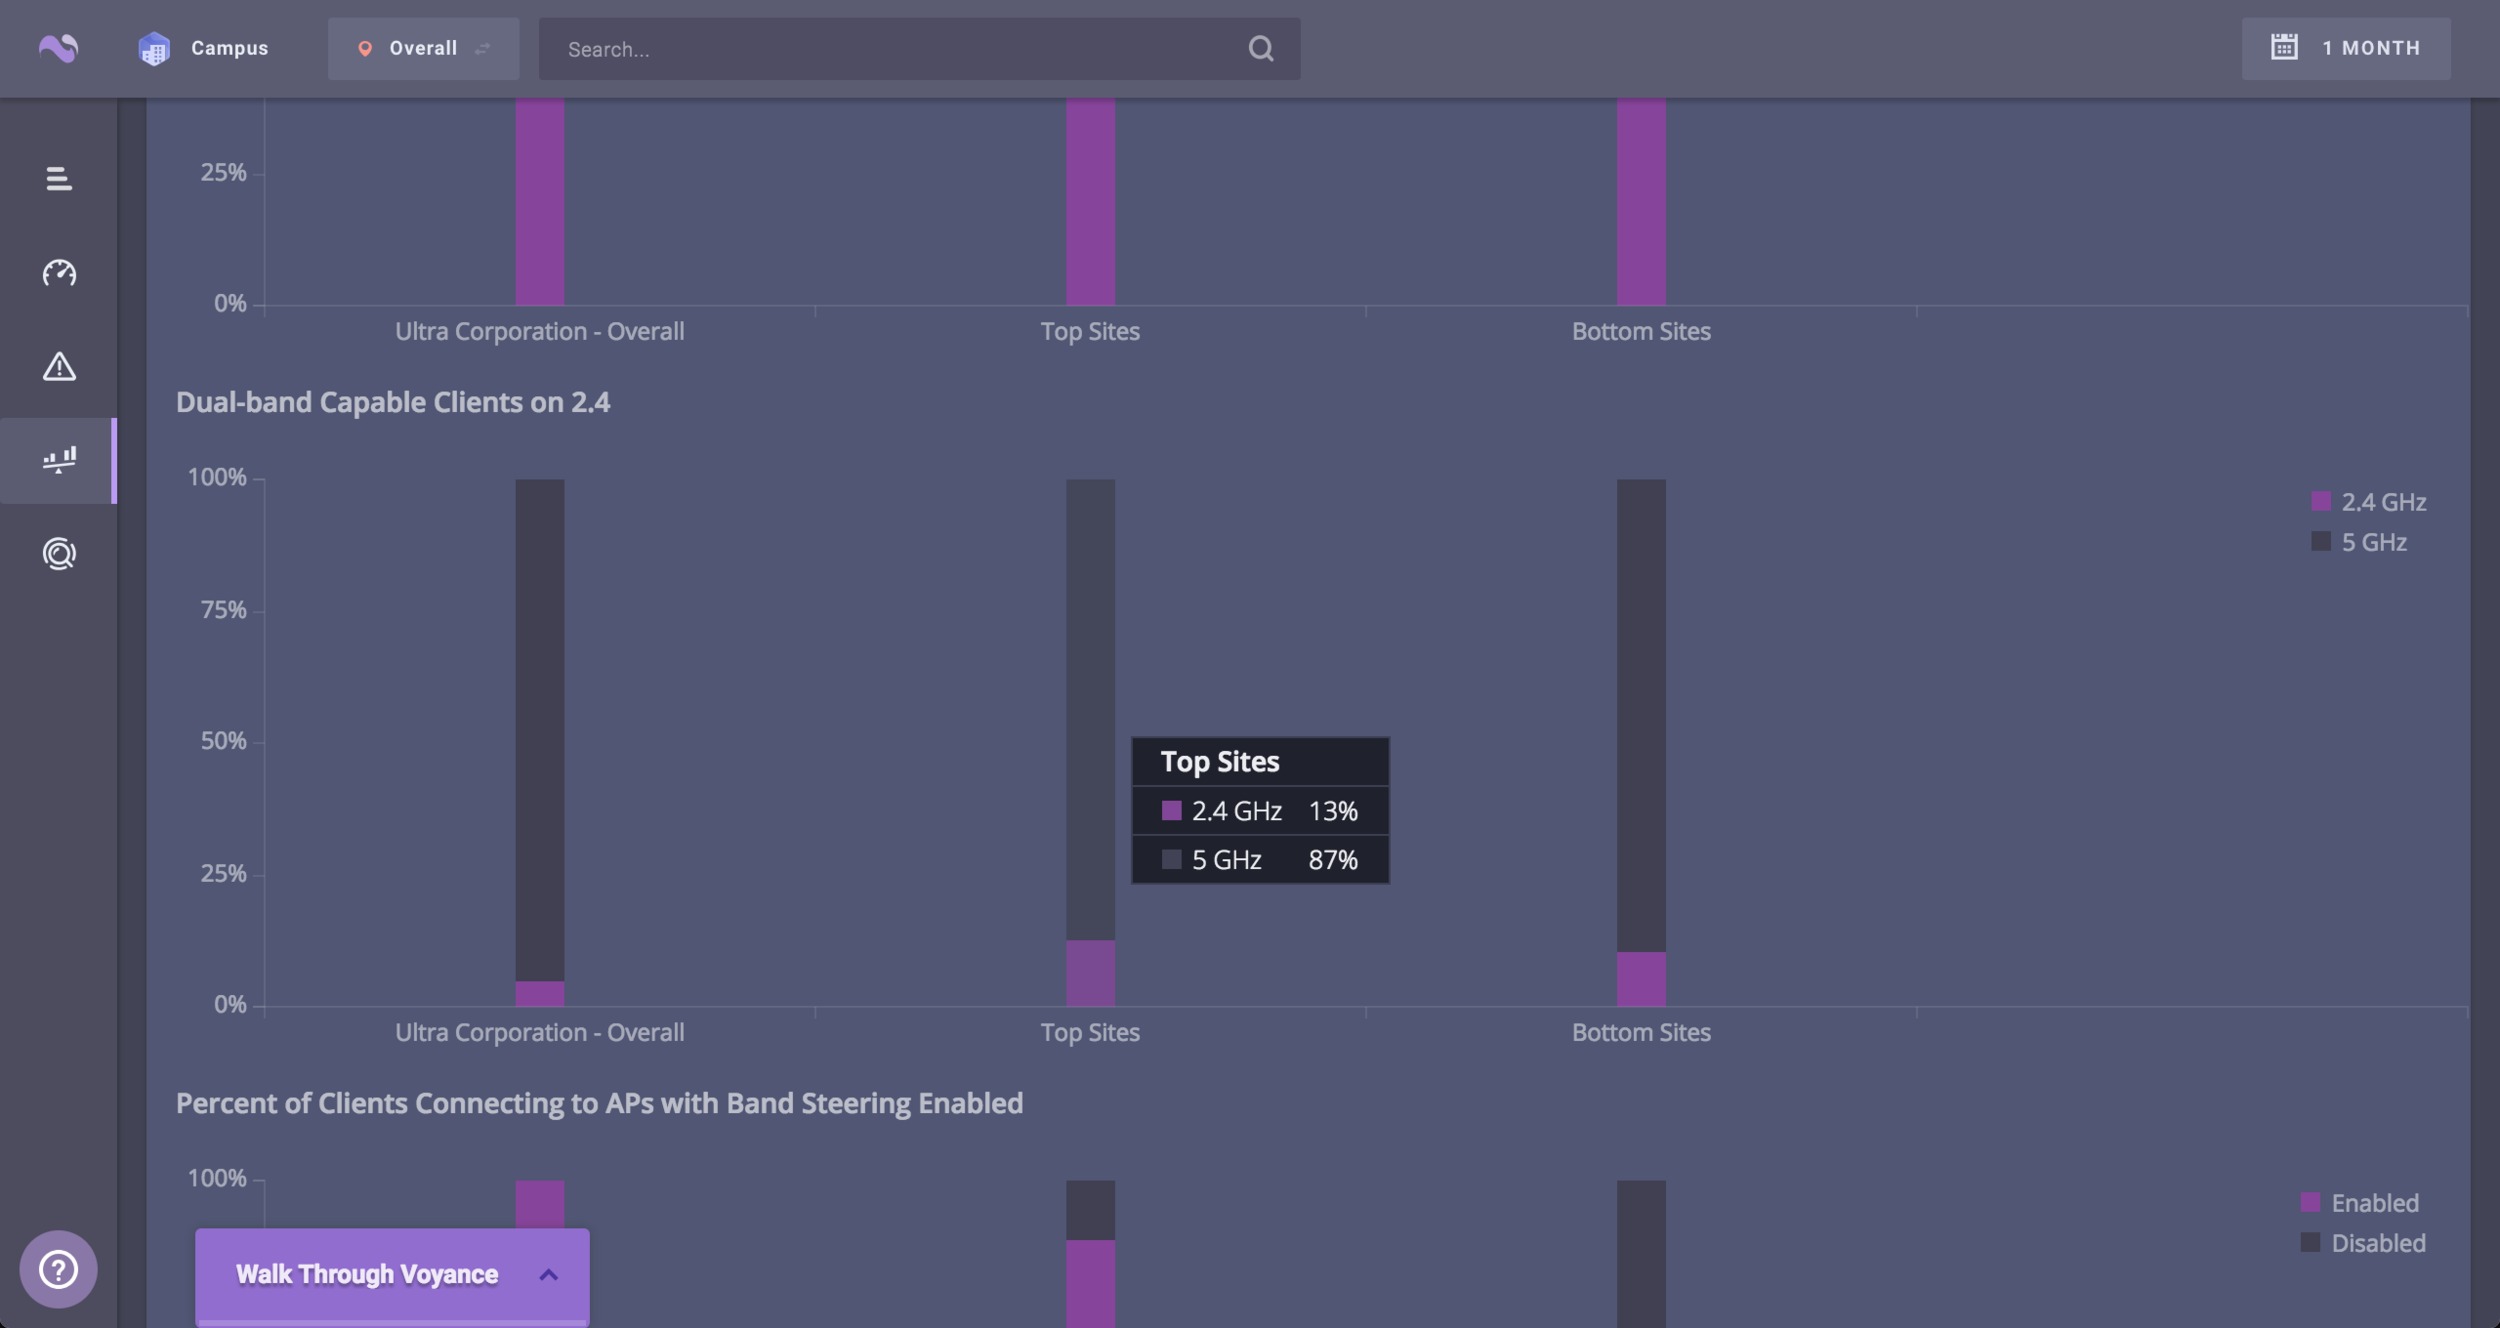
We continued to adjust and refine our analysis section, adding new features and removing unnecessary distractions. We also took some time to unify the application style guide and have all pieces speaking the same language. Below is the current state of "Analysis", freshly built with a new coat of paint and a more refined design system.